The Big Story
Quick Take:
-
Median purchase price continues to tick up, increasing by 2.75% on a year-over-year basis nationwide.
-
The average 30-year mortgage rate continues to slowly fall, reaching 6.63% in the month of March.
-
The number of sales has declined slightly, while inventory skyrocketed on a year-over-year basis.
Note: You can find the charts & graphs for the Big Story at the end of the following section.
*National Association of REALTORS® data is released two months behind, so we estimate the most recent month's data when possible and appropriate.
Inventories levels explode while existing home sales decline slightly
Although we’re still at the point in the season where inventories are supposed to build, they have increased by nearly 20% on a year-over-year basis, from 1,110,000 to 1,330,000, showing that people are hesitant to purchase a new home. Additionally, while inventories have been increasing, the number of existing homes being sold has decreased slightly on a year-over-year basis, with March 2025 numbers coming in at 4,020,000, which is 2.43% lower than where they were last year. Across the country, people are becoming more uncertain of whether or not they should move to a new home, and that is very clearly showing!
This data is just for March though; it will be important to pay attention to how the market reacted to the beginning of the trade war when April’s numbers come out in a couple of weeks. While it’s easy to see how things like the stock market and bond market react to big newsworthy events like this, real estate is incredibly illiquid, so it takes some time for things to play out!
As you might have expected, there was a considerable increase in the number of listings that have hit the market too. For a few months in a row we have seen high single/low double-digit percentage growths in the number of new listings hitting the market in the US. This is likely due to the fact that the people who were holding out for the return of lower interest rates are losing hope, and listing their homes anyway.
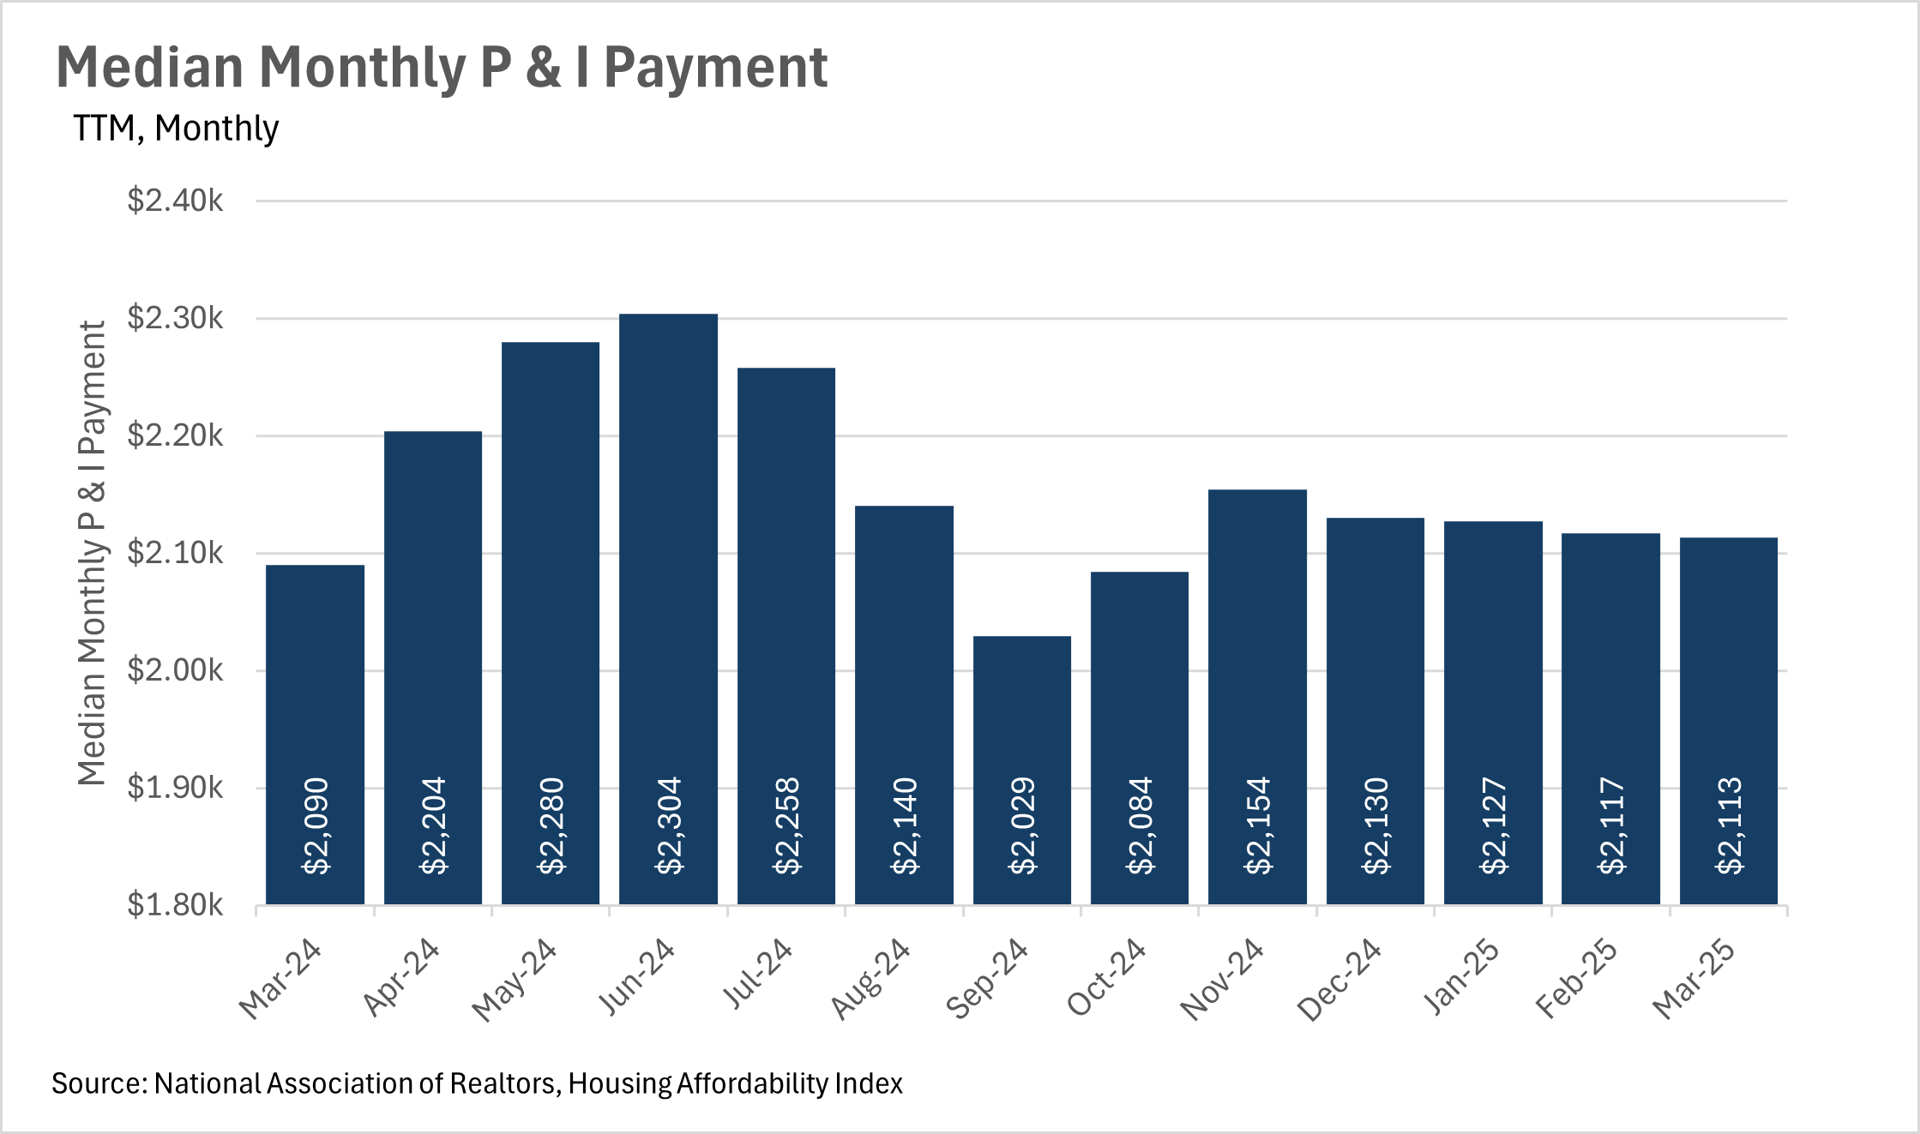
On the bright side, mortgage rates have continued their slow descent, with the average interest rate on a 30-year mortgage in March coming in at around 6.63%, down roughly a quarter point from the year prior. As you might expect, the median monthly P&I payment ticked down slightly, and the median sale price ticked up slightly to match this move.
Although mortgage rates have come down a bit, it’s important to remember that the biggest drivers behind mortgage rates are, of course, the 10-year treasury and the federal funds rate. In the most recent Federal Open Market Committee meeting, the Fed has decided to keep the federal funds rate in line with where it’s been over the past few months, despite many Americans feeling the effects of the trade war on their wallets.
As we have discussed in prior months, the Fed is in no rush to lower interest rates anytime soon. However, they do see a not-so-distant future where rates are a good bit lower. When you combine this with the fact that inventories are building at a rapid rate, and the number of units being sold has fallen slightly, this could represent a fantastic buying opportunity!
Ultimately though, this is just what we’re seeing at a national level. As we all know, real estate is an incredibly localized industry, so knowing what’s going on in your own market is pivotal. Below is our local lowdown, that outlines everything you need to know about what’s happening around you in your neighborhood and surrounding areas!
Big Story Data


The Local Lowdown
Quick Take:
- Median sale prices show modest growth in Orange County, with a 3.57% year-over-year increase in March 2025.
- Inventory levels continue their dramatic surge, with single-family home inventory showing a 74.68% year-over-year increase in March.
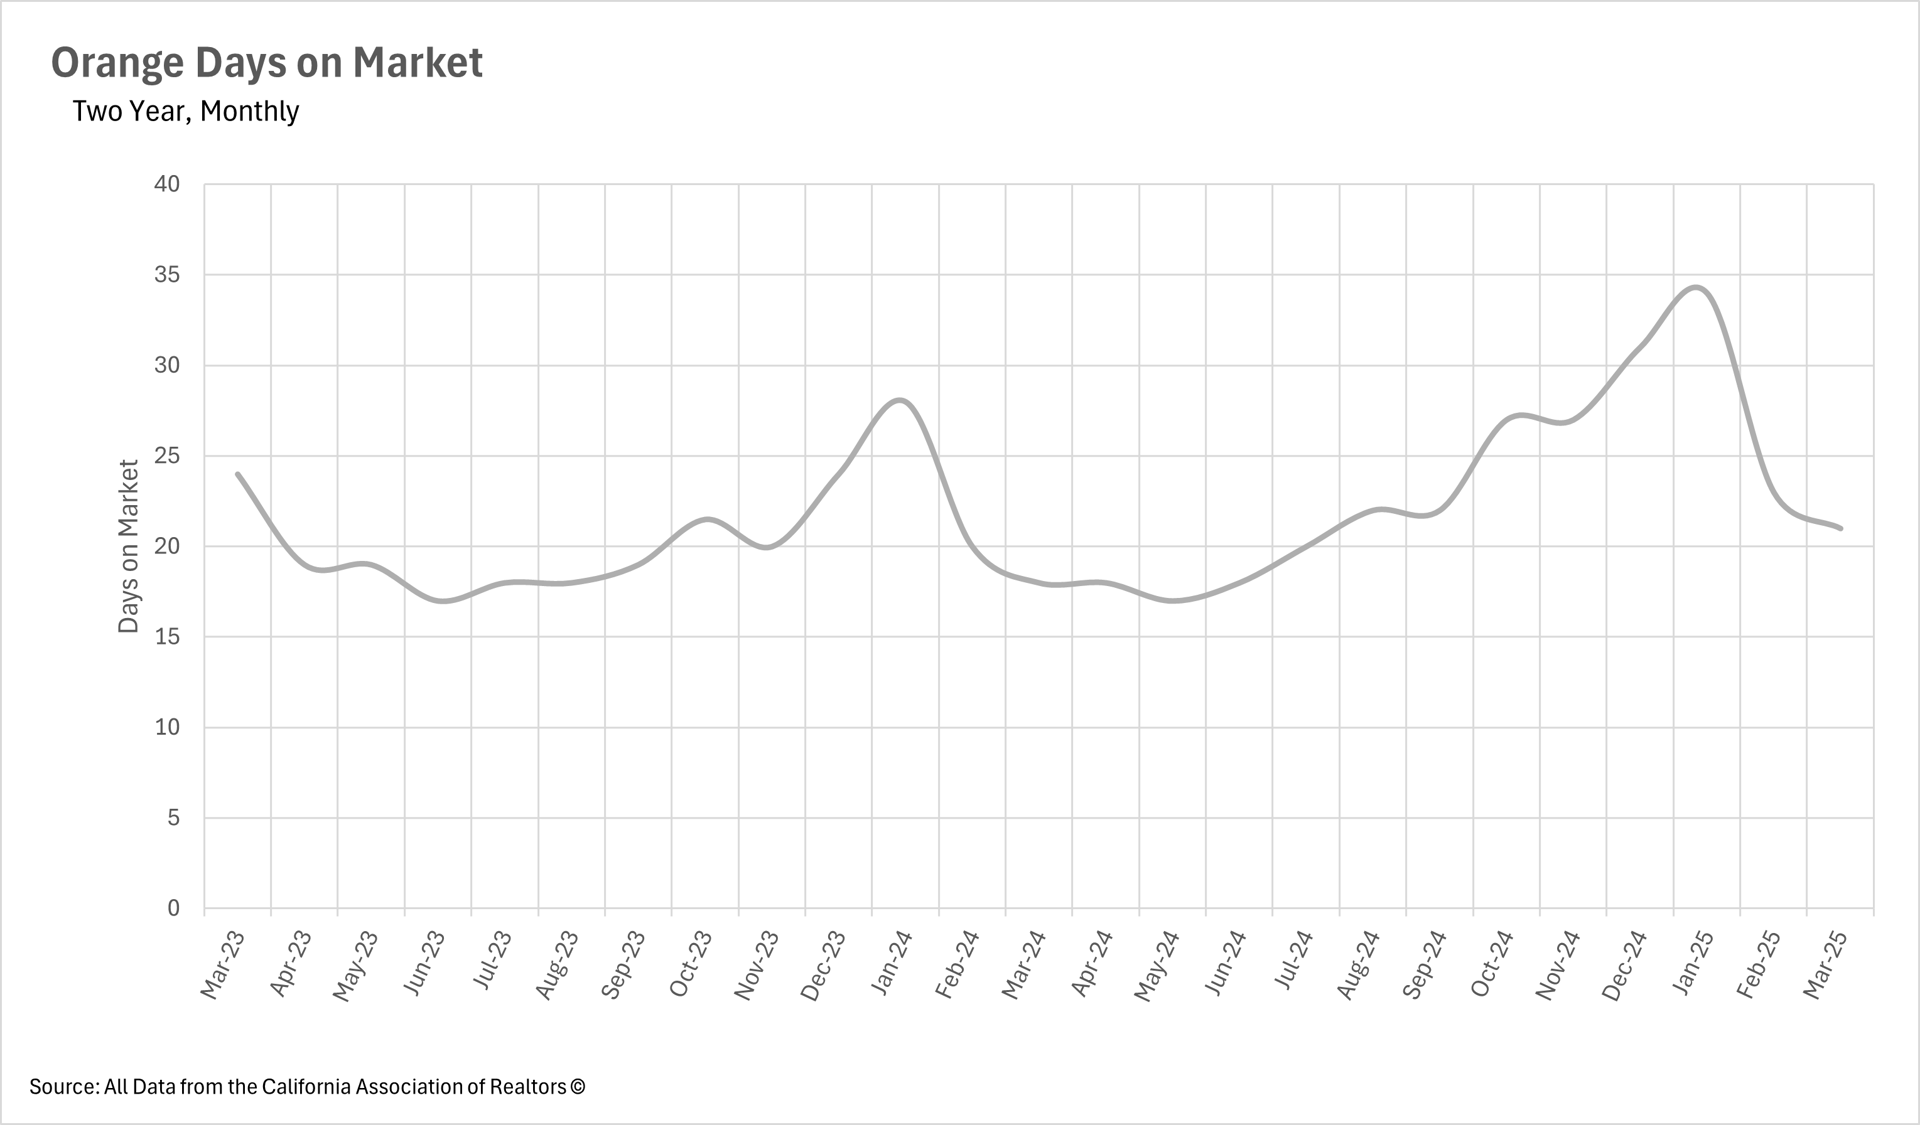
- The median listing is now spending 21 days on the market, representing a 16.67% increase compared to the same time last year.
Note: You can find the charts/graphs for the Local Lowdown at the end of this section.
Price Growth Moderates in Orange County's Housing Market
Orange County's real estate market is showing signs of cooling off from its earlier rapid growth pattern. March 2025 saw the median single-family home selling for $1,450,000, representing a more modest 3.57% increase compared to March 2024. This marks a significant slowdown from the 8.56% year-over-year growth observed in February and 8.33% in January. The median price actually decreased slightly from February to March (-1.06%), suggesting that the market may be stabilizing after the robust growth experienced in recent months.
Inventory Explosion Continues as Spring Market Heats Up
The Orange County housing market is experiencing an unprecedented surge in available inventory. The latest data for April 2025 shows 3,843 single-family homes on the market, representing a staggering increase that continues the upward trend we've been tracking. Looking at March 2025, there were 3,312 single-family homes on the market, representing a 74.68% increase compared to March 2024. This dramatic growth trend has continued unabated, with month-over-month inventory increasing 16.03% from March to April 2025. For context, inventory has now grown for three consecutive months, following increases in both February and March. Buyers now have considerably more options than at any point in the past three years, significantly altering the market dynamics in their favor.
Market Pace Continues to Favor Deliberate Buyers
With the influx of inventory, buyers continue to take more time with their purchasing decisions, though there are signs of seasonal acceleration. The median single-family home in Orange County now sits on the market for 21 days before selling, representing a 16.67% increase from March 2024. While this is slightly faster than February's 23-day average (representing an 8.70% month-over-month decrease), it still points to a market where buyers can afford to be more selective and deliberate with their choices. This pace is notably slower than the sub-20 day figures we saw throughout most of 2024, suggesting a structural shift in market dynamics that sellers need to account for in their planning.
Orange County Maintains Its Balanced Market Status
When determining whether a market is a buyers' market or a sellers' market, we look to the Months of Supply Inventory (MSI) metric. The state of California has historically averaged around three months of MSI, so any area with at or around three months of MSI is considered a balanced market. Any market that has lower than three months of MSI is considered a sellers' market, whereas markets with more than three months of MSI are considered buyers' markets.
With 2.9 months of supply inventory in March 2025, Orange County remains firmly in balanced market territory, though it has pulled back slightly from February's 3.4 months of supply. This still represents a significant shift from a year ago when the market had only 2.2 months of supply, indicating a seller's market. Despite the slight month-over-month decrease in MSI (-14.71%), the year-over-year increase of 31.82% confirms the broader trend toward market equilibrium. This near-balanced state means neither buyers nor sellers have overwhelming leverage, creating a more level playing field for negotiations heading into the traditionally busy spring and summer seasons.