The Big Story
Quick Take:
-
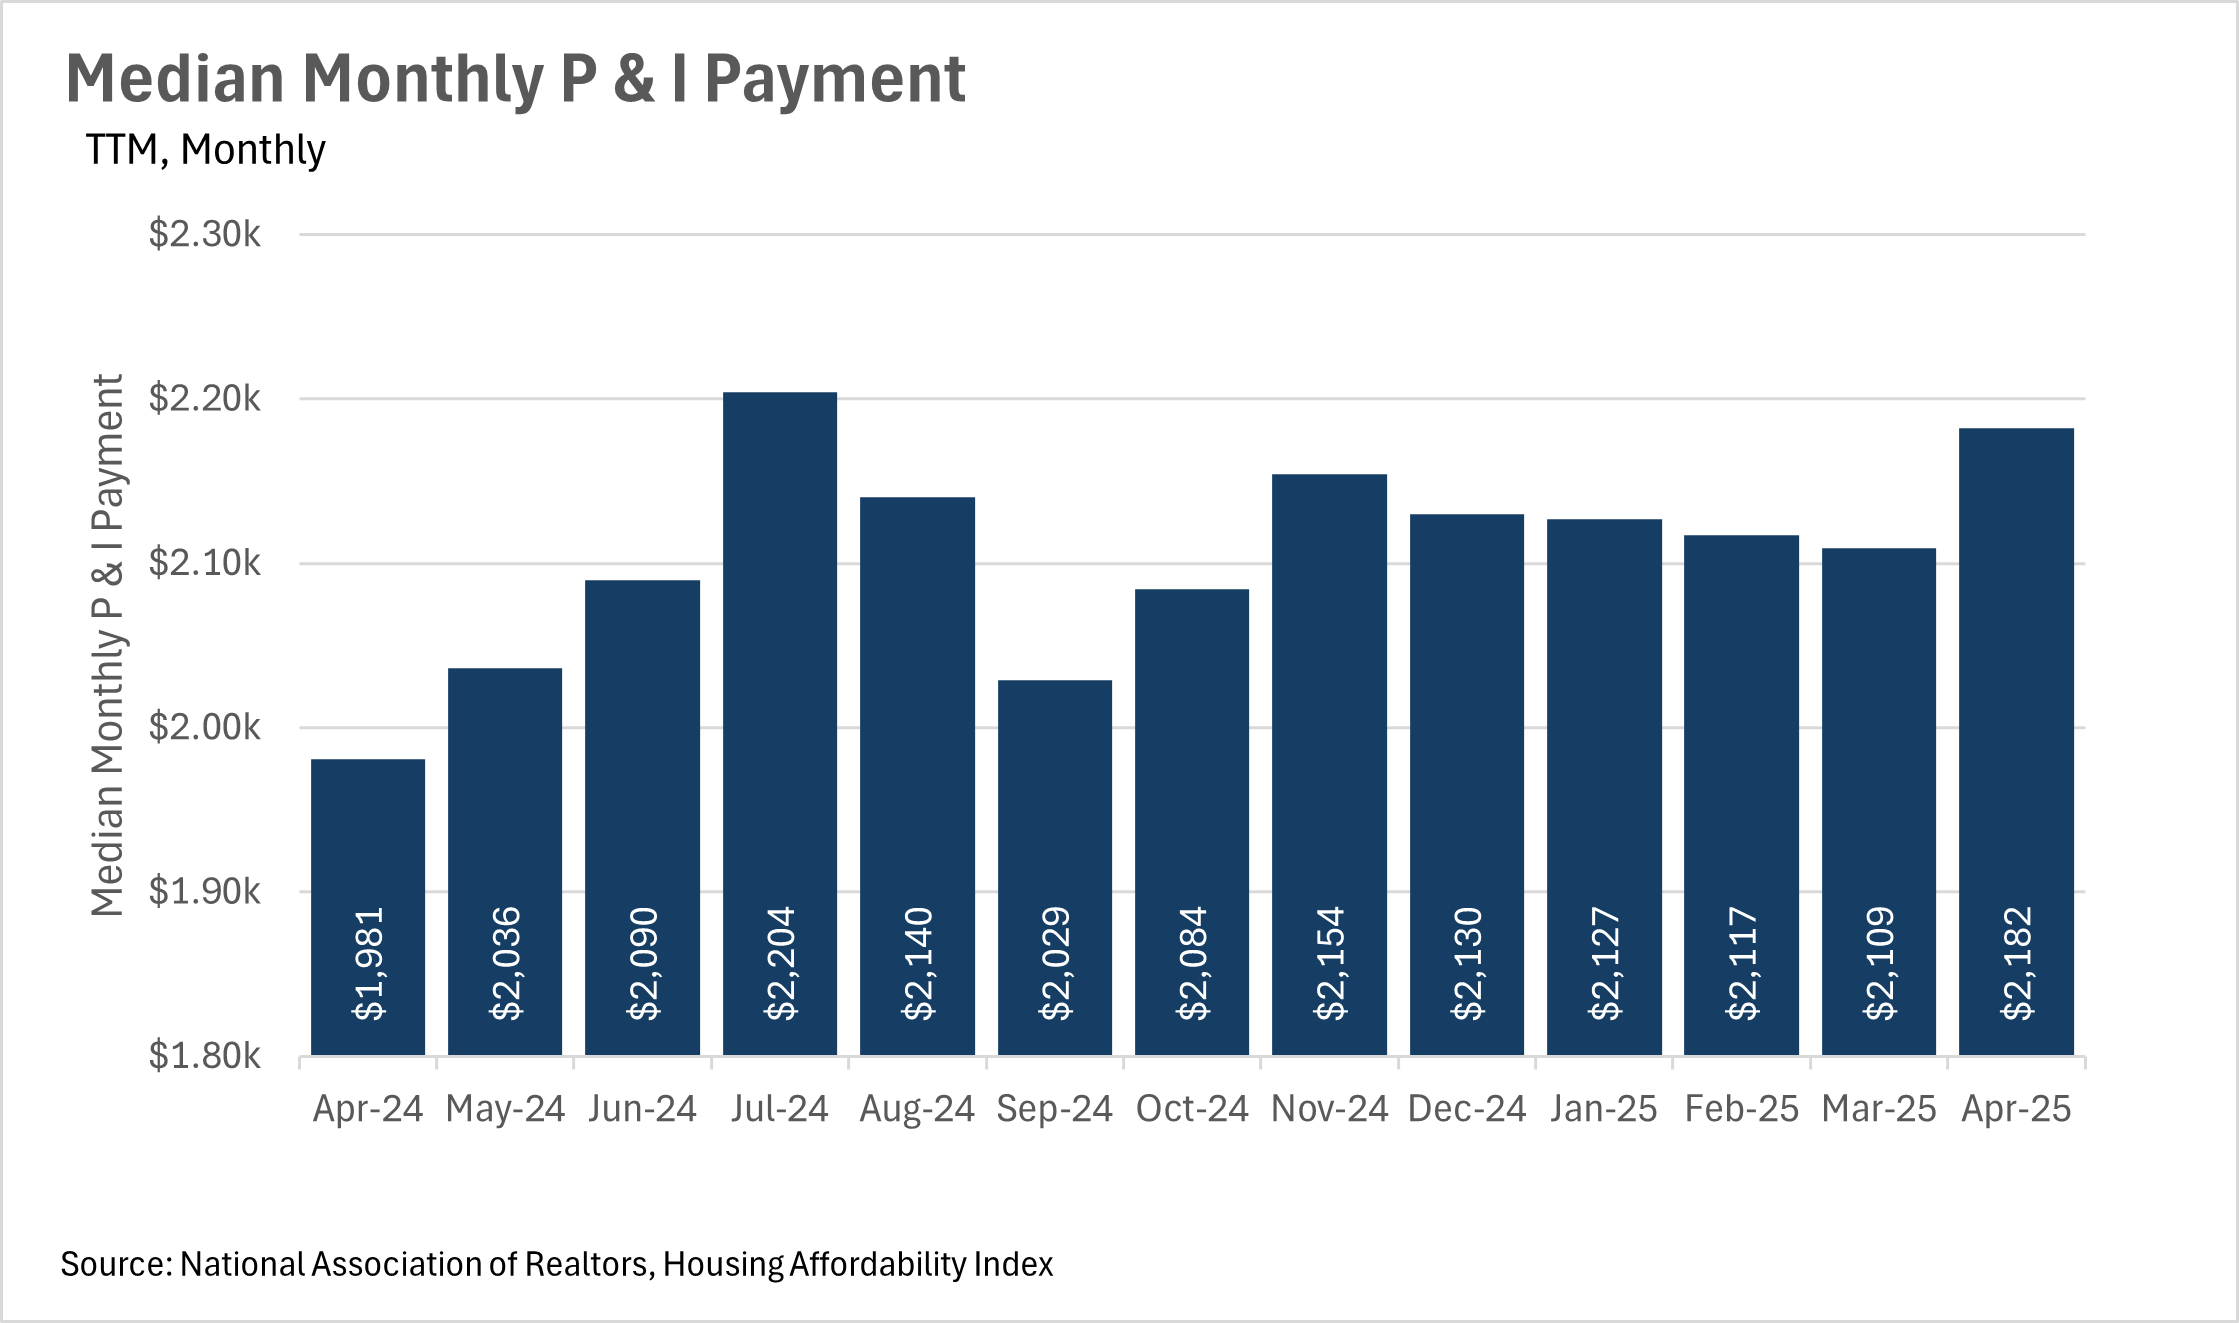
Affordability remains an issue nationwide, as the median monthly P&I payment ticked up by 10.15% on a year-over-year basis at the end of April.
-
Mortgage rates have continued to hold the mid-six percent range that we’ve seen for over six months.
-
Inventories continue to climb throughout the country, while home sales start to slow down.
-
The recent global economic and geopolitical instability that we’ve seen likely won’t help the market, as uncertainty may lead people to stay where they are.
Note: You can find the charts & graphs for the Big Story at the end of the following section.
*National Association of REALTORS® data is released two months behind, so we estimate the most recent month's data when possible and appropriate.
The housing affordability issue continues to grow
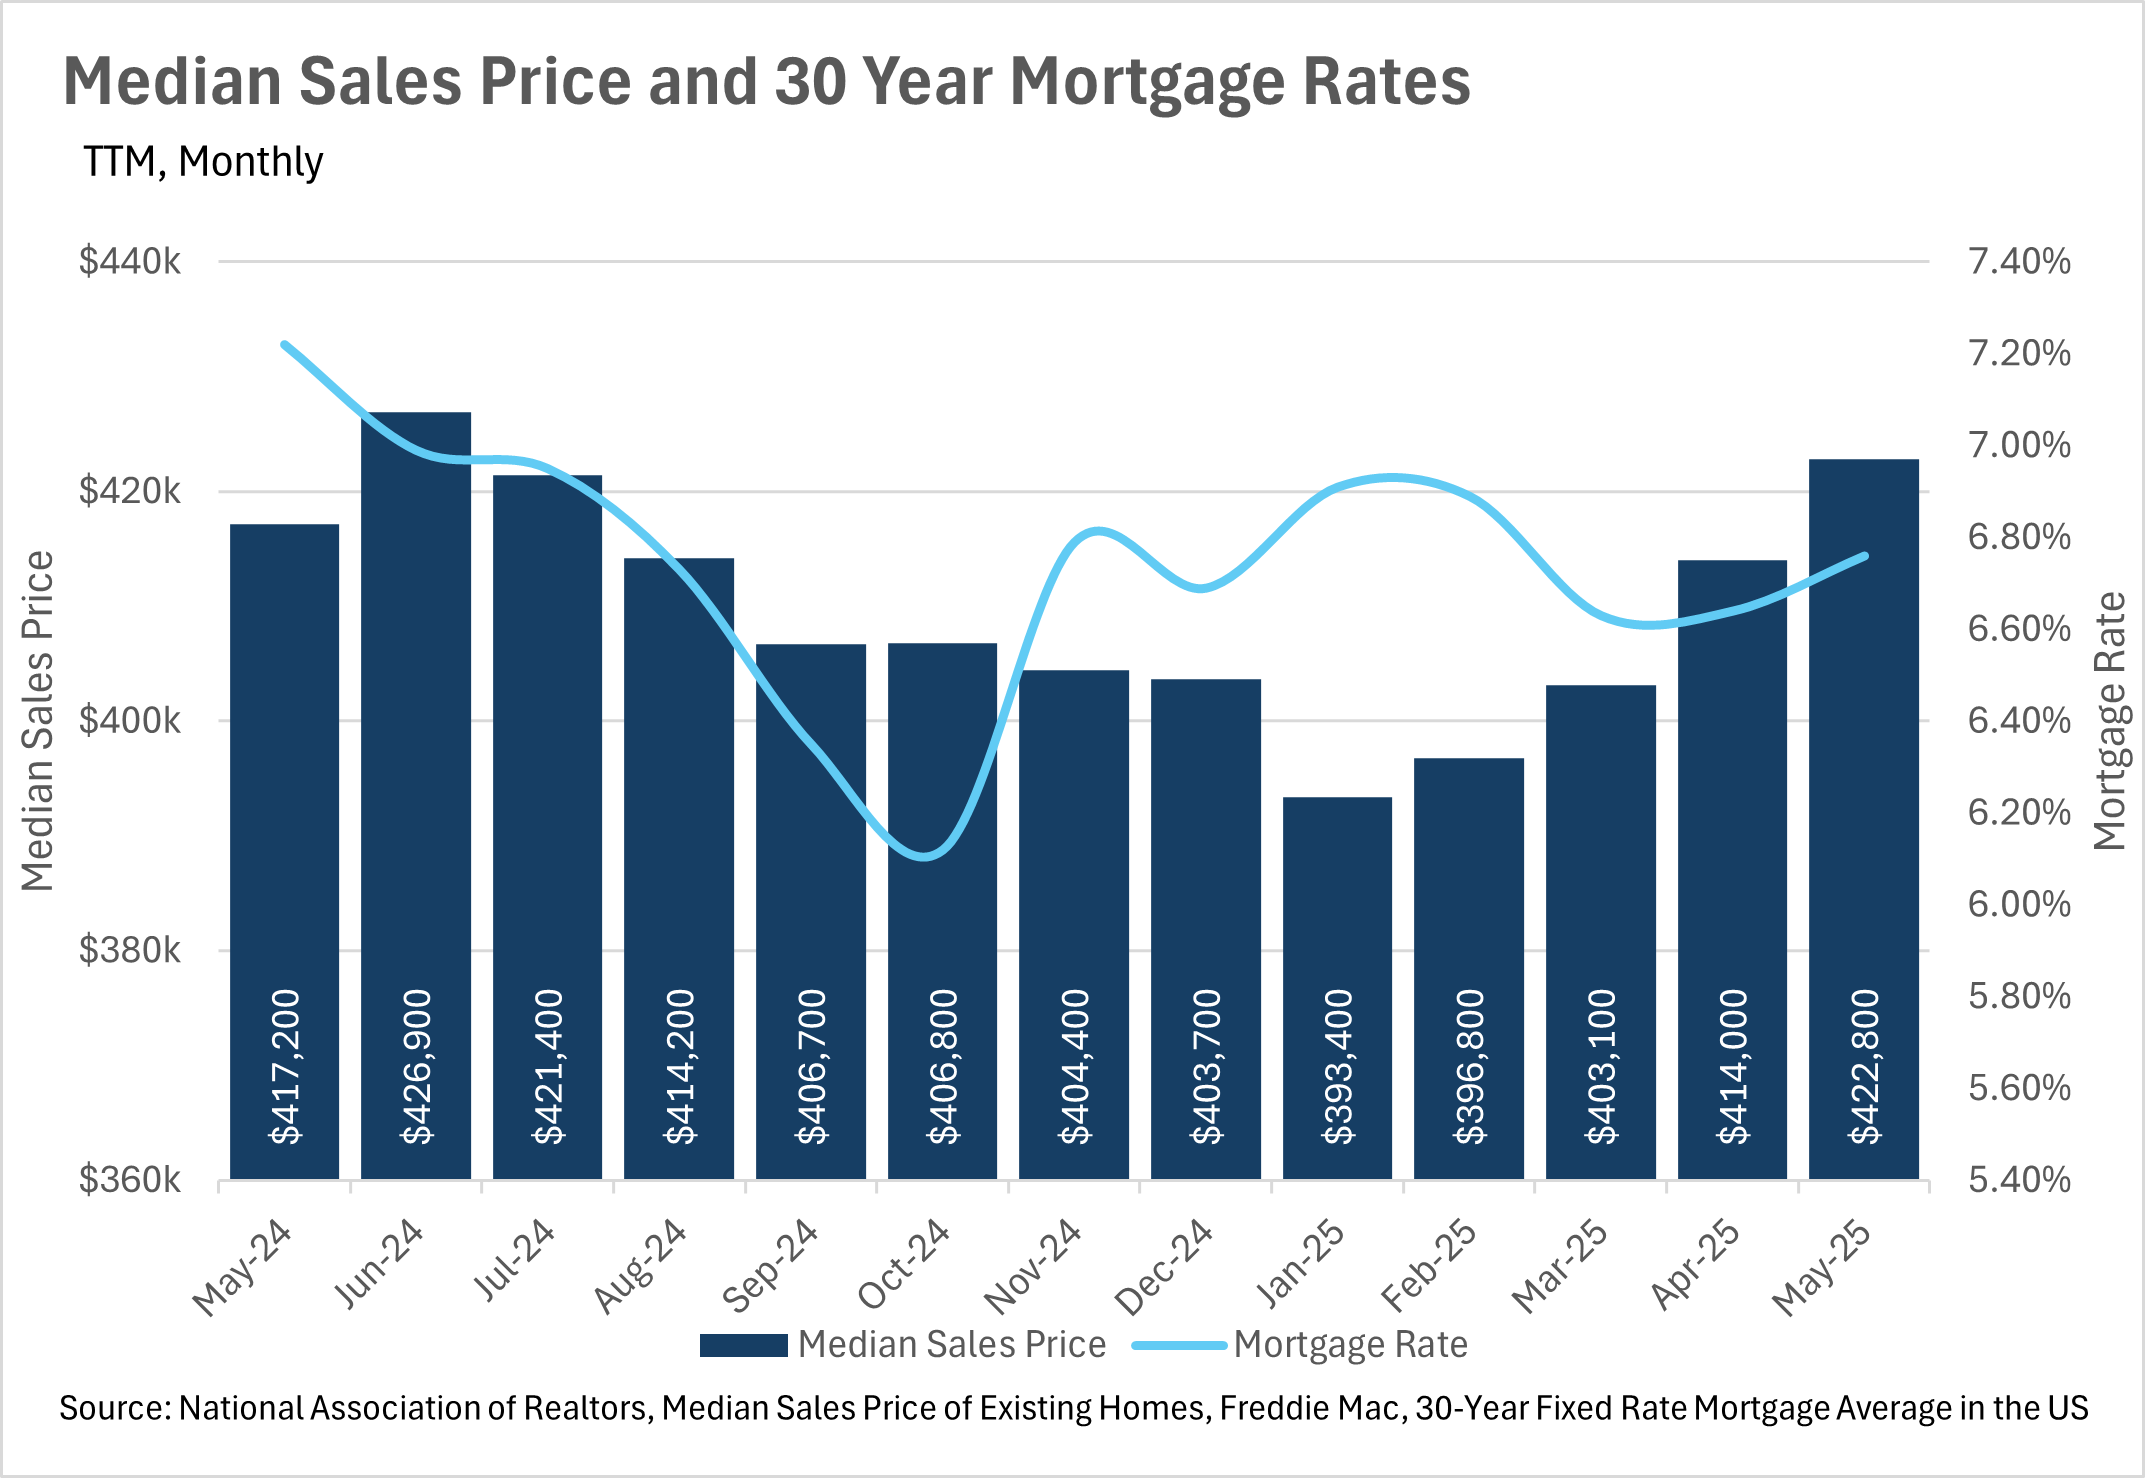
As we all know, housing affordability has been a problem on a national scale for quite a few years at this point. At this point in time, many find it hard to believe that the housing market will return to pre-pandemic levels in terms of affordability at any point in the near future. Unfortunately, things have not gotten much better, as the median monthly P&I payment increased by 10.15% on a year-over-year basis, to $2,182 in the month of April. This jump in P&I payment represents a drastic month-over-month jump of 3.46%. This jump is actually quite perplexing, as median home sale prices have increased by 1.34% on a year-over-year basis, while mortgage rates have actually come down.
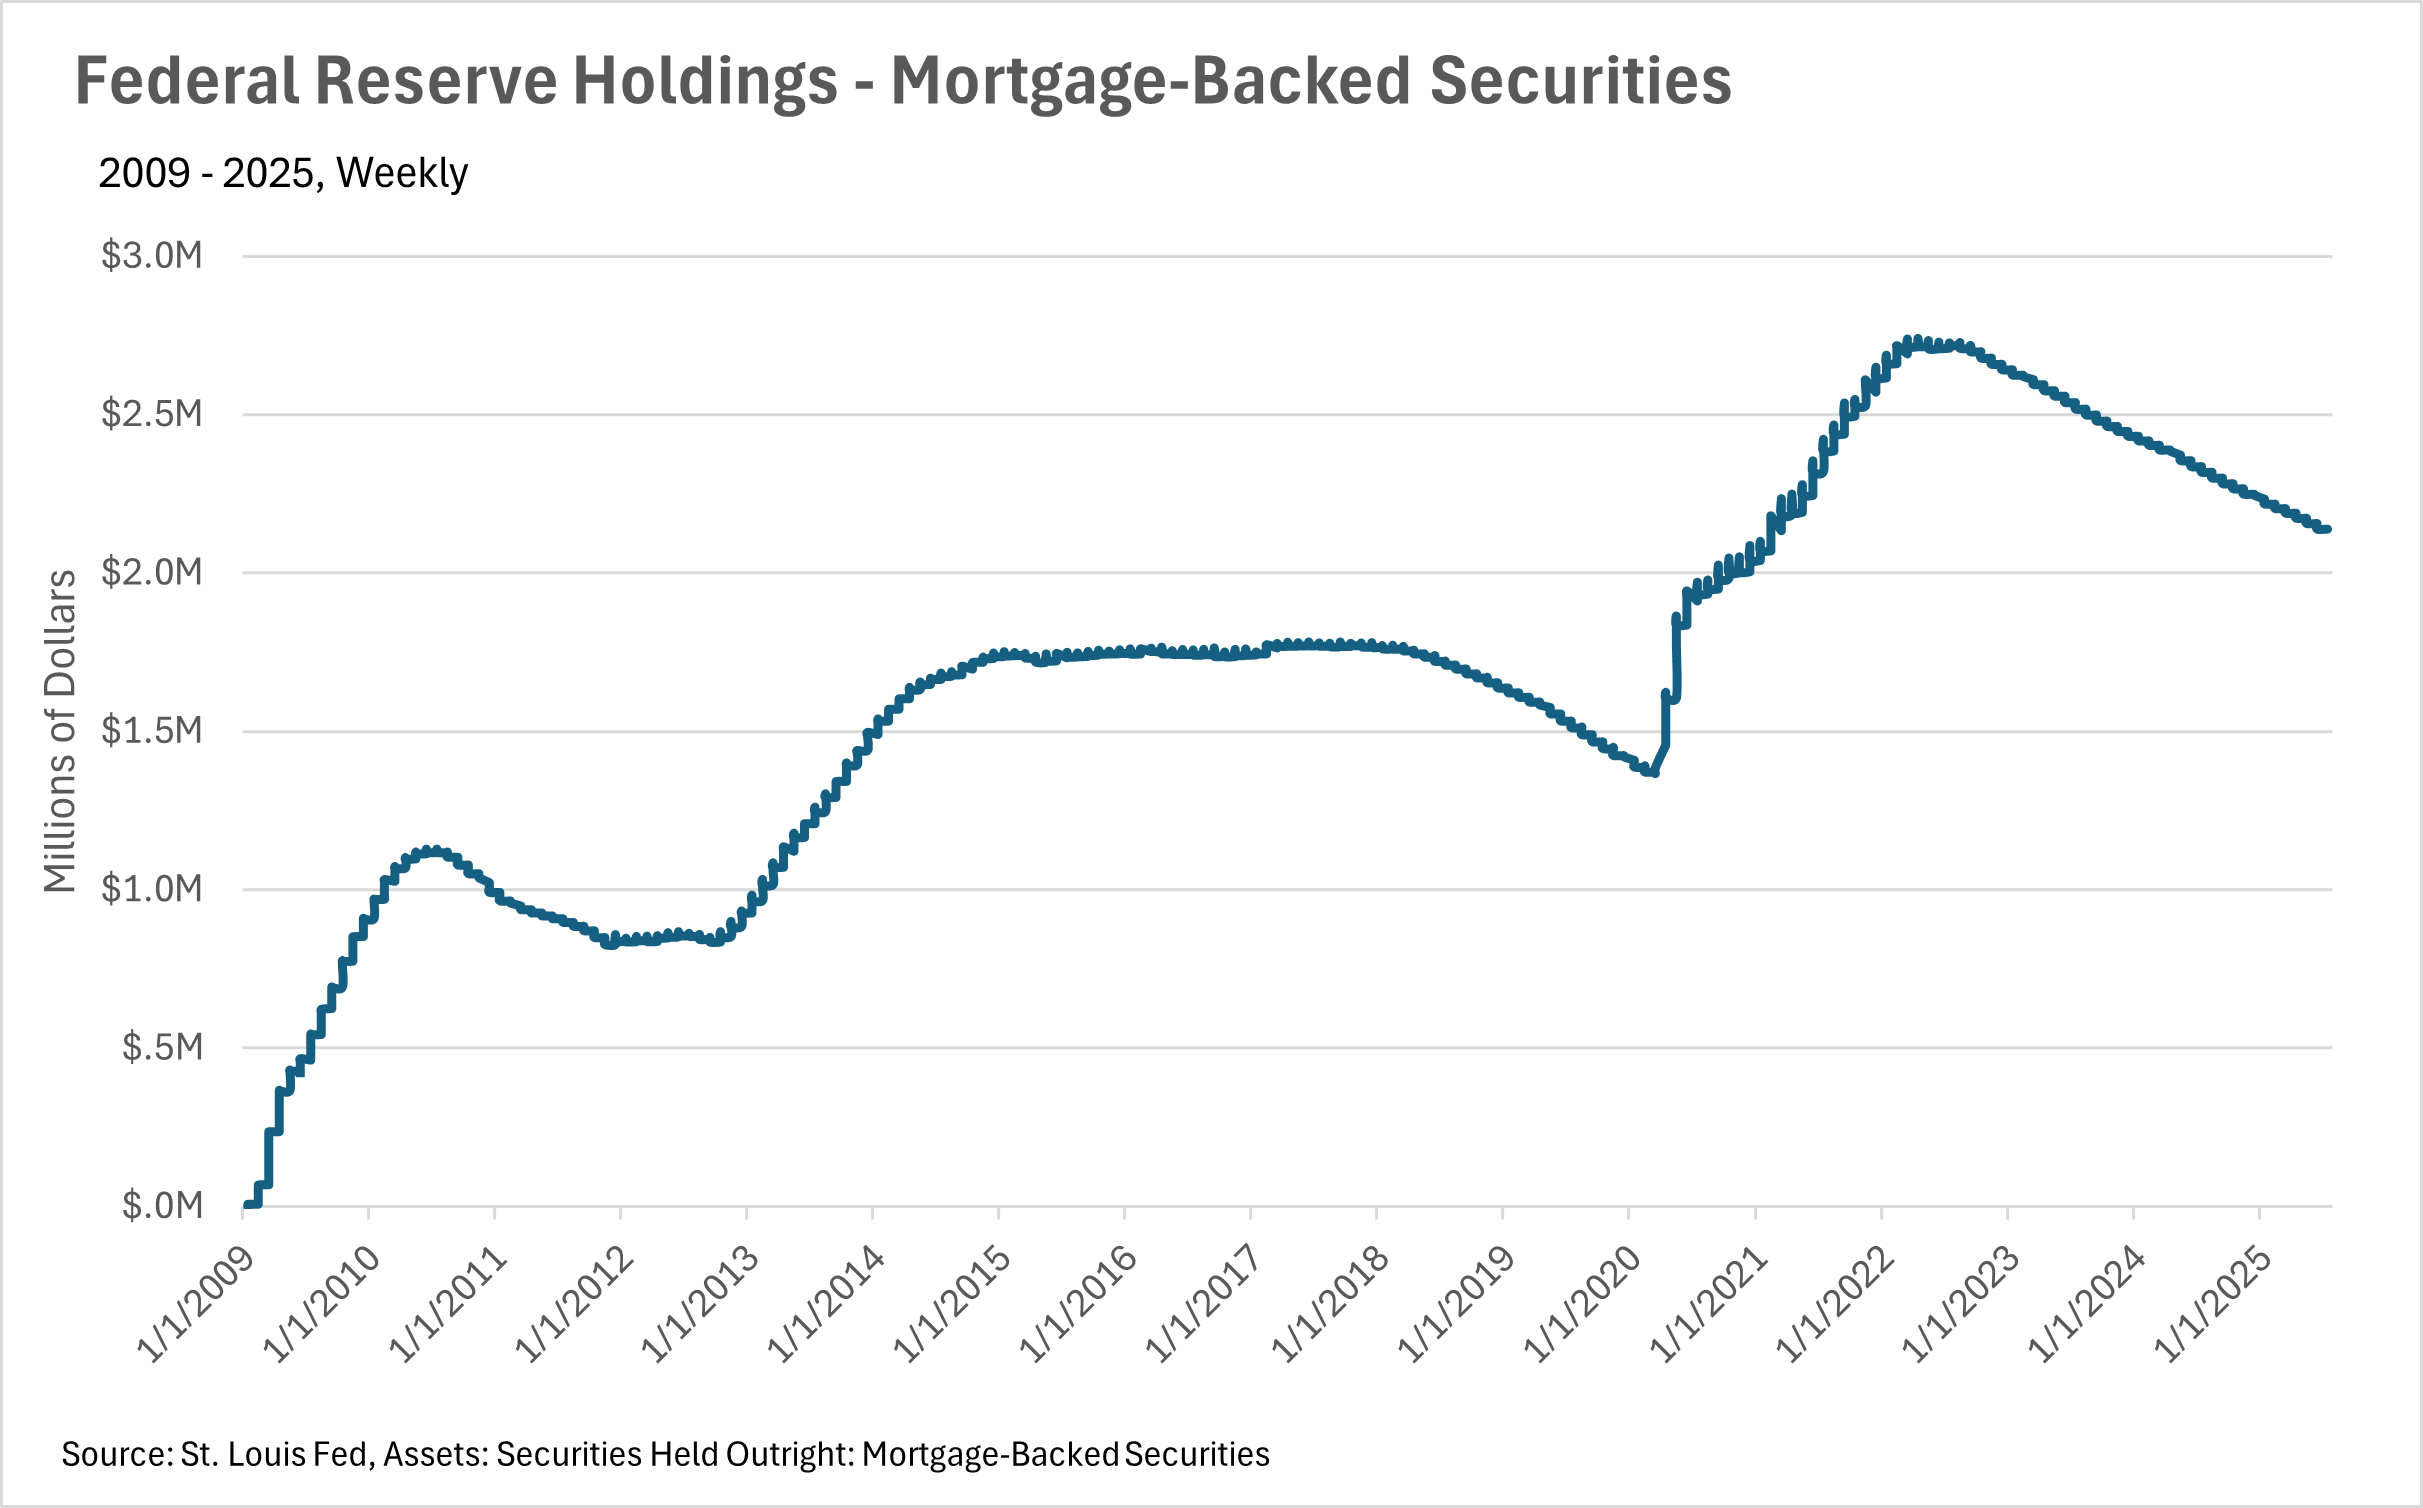
Mortgage rates remain stagnant in the mid-six percent range
For the past few months, mortgage rates have remained fairly stable, in the mid-six percent range. Although the stability that we’ve seen is a good thing, the levels they’ve stabilized at are quite a bit higher than recent historical averages. This, of course, is one of the leading causes of the affordability issues that we’ve seen recently.
It is worth noting, though, that we might see some discounted rates toward the back half of the year. Although the Fed has not touched the federal funds rate in nearly a year, the Fed chairman has signaled that one to two rate cuts are expected by the end of the year, so long as there aren’t any further spikes in inflation.
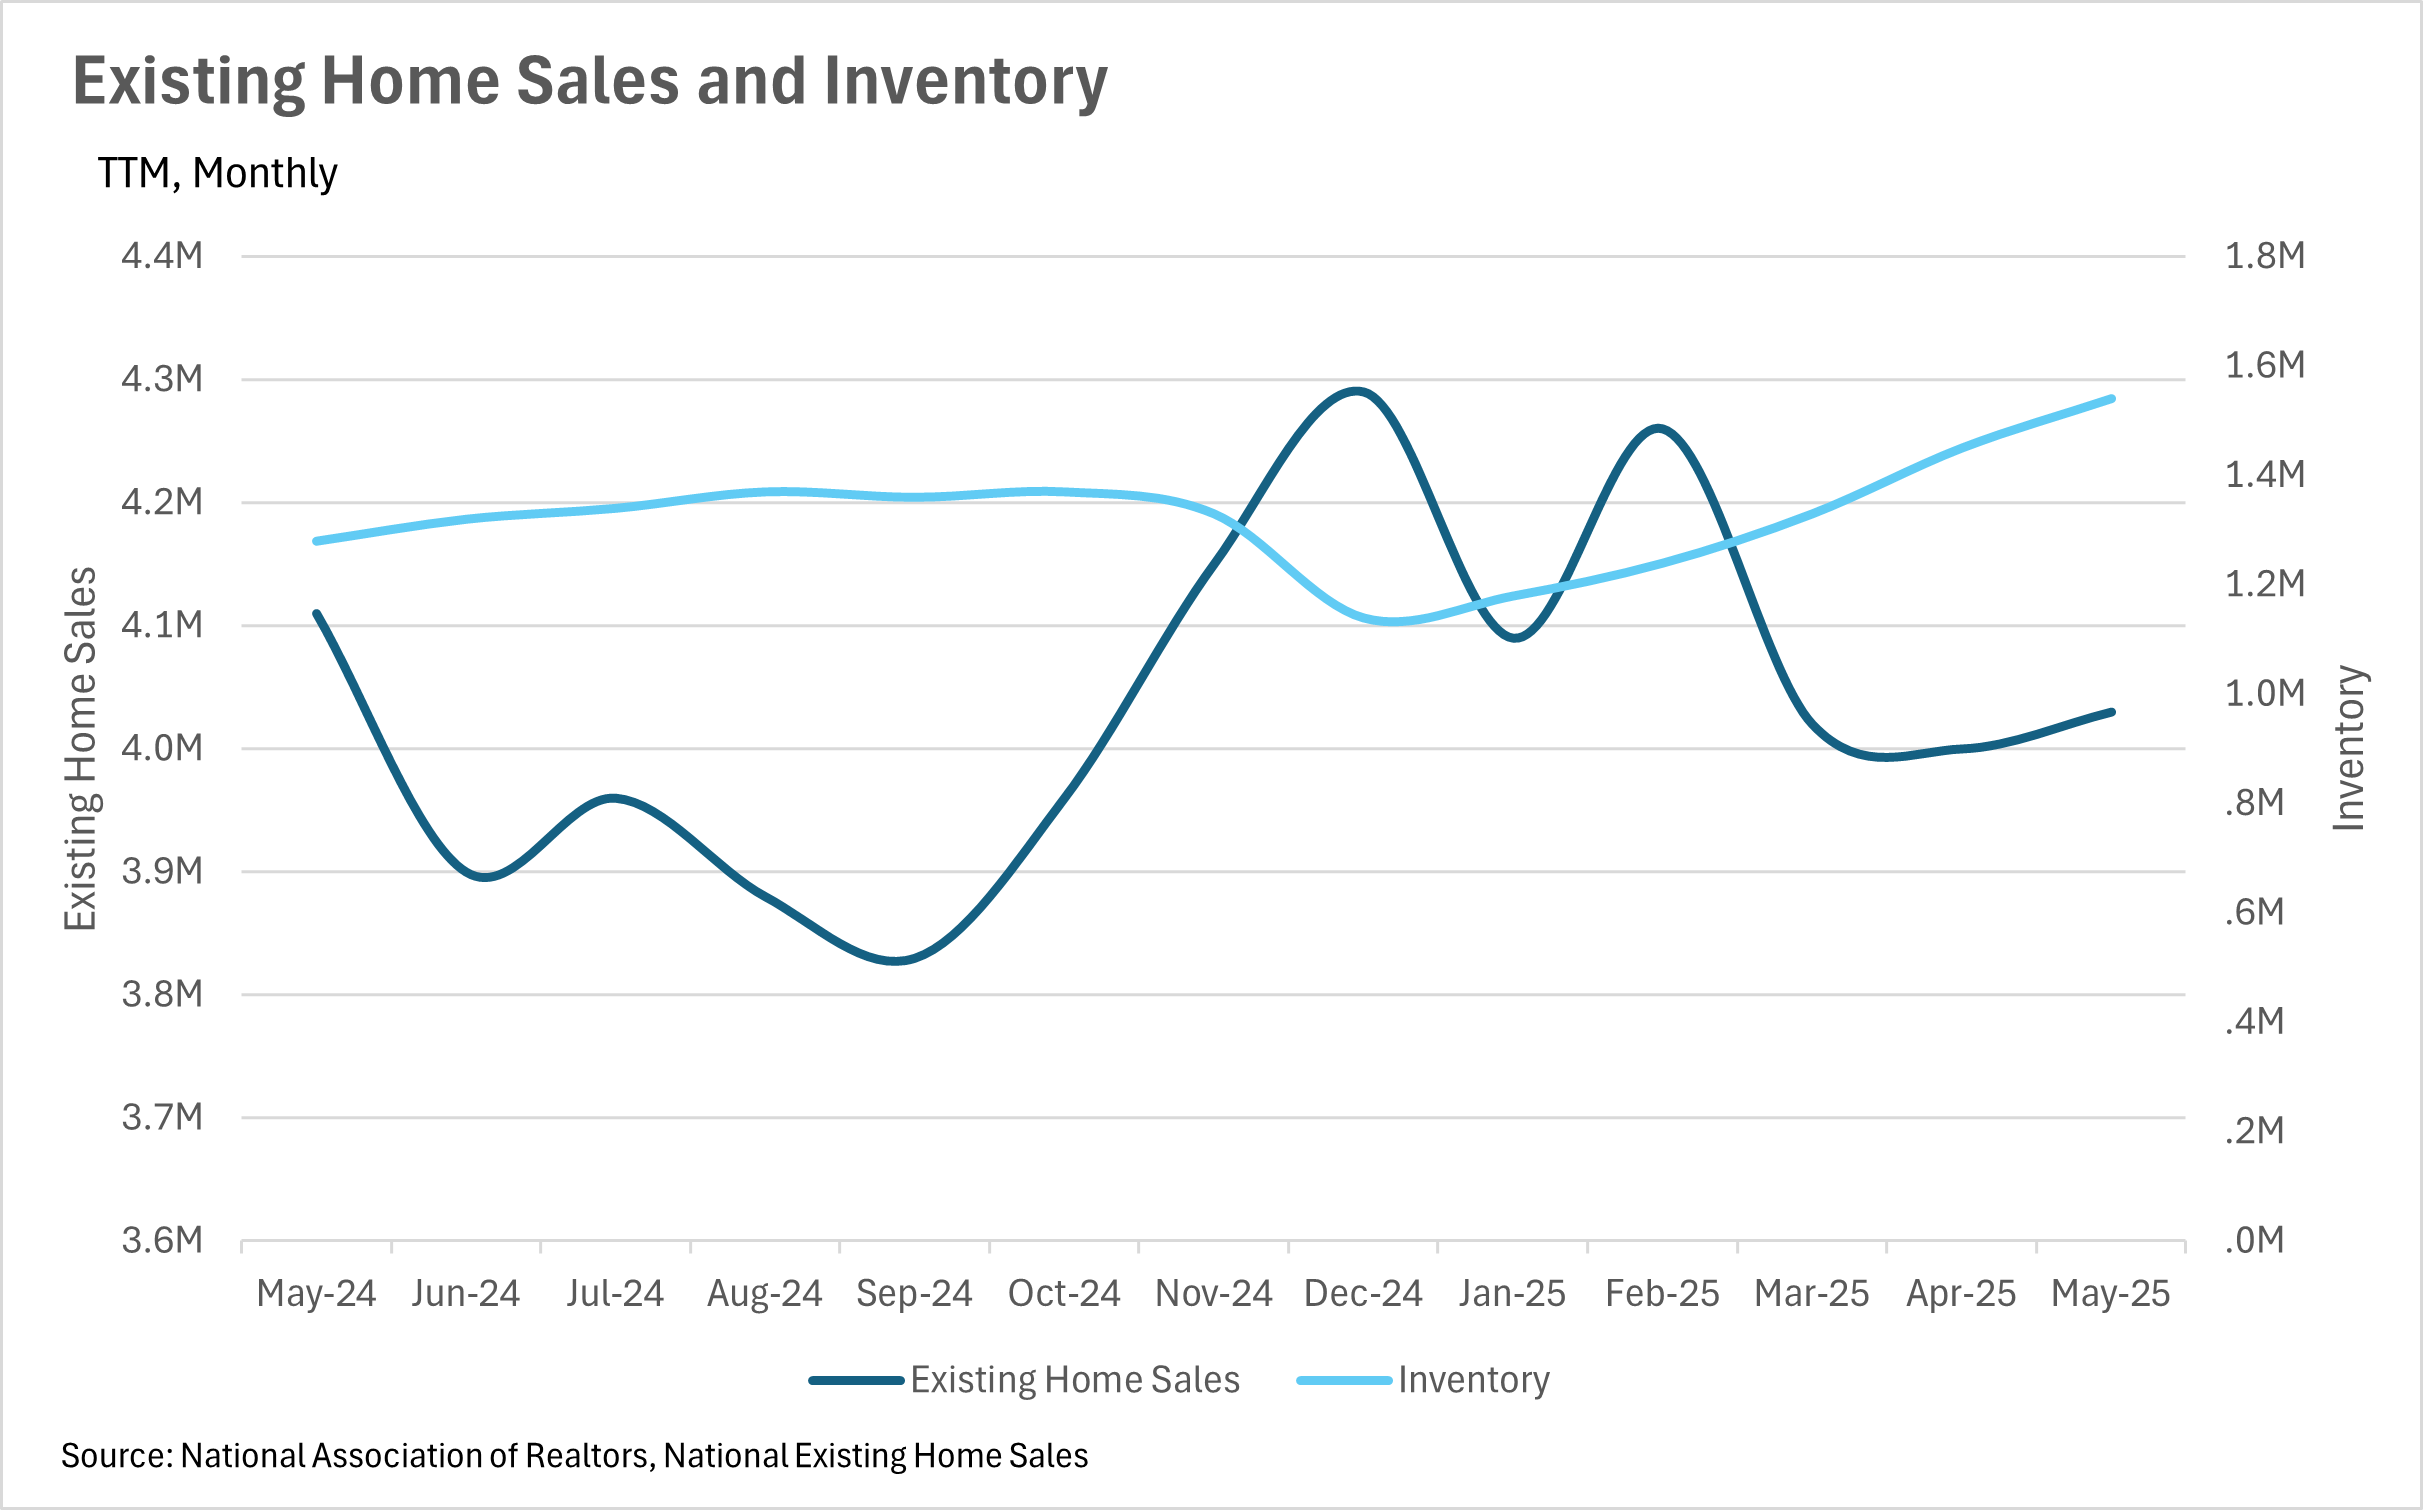
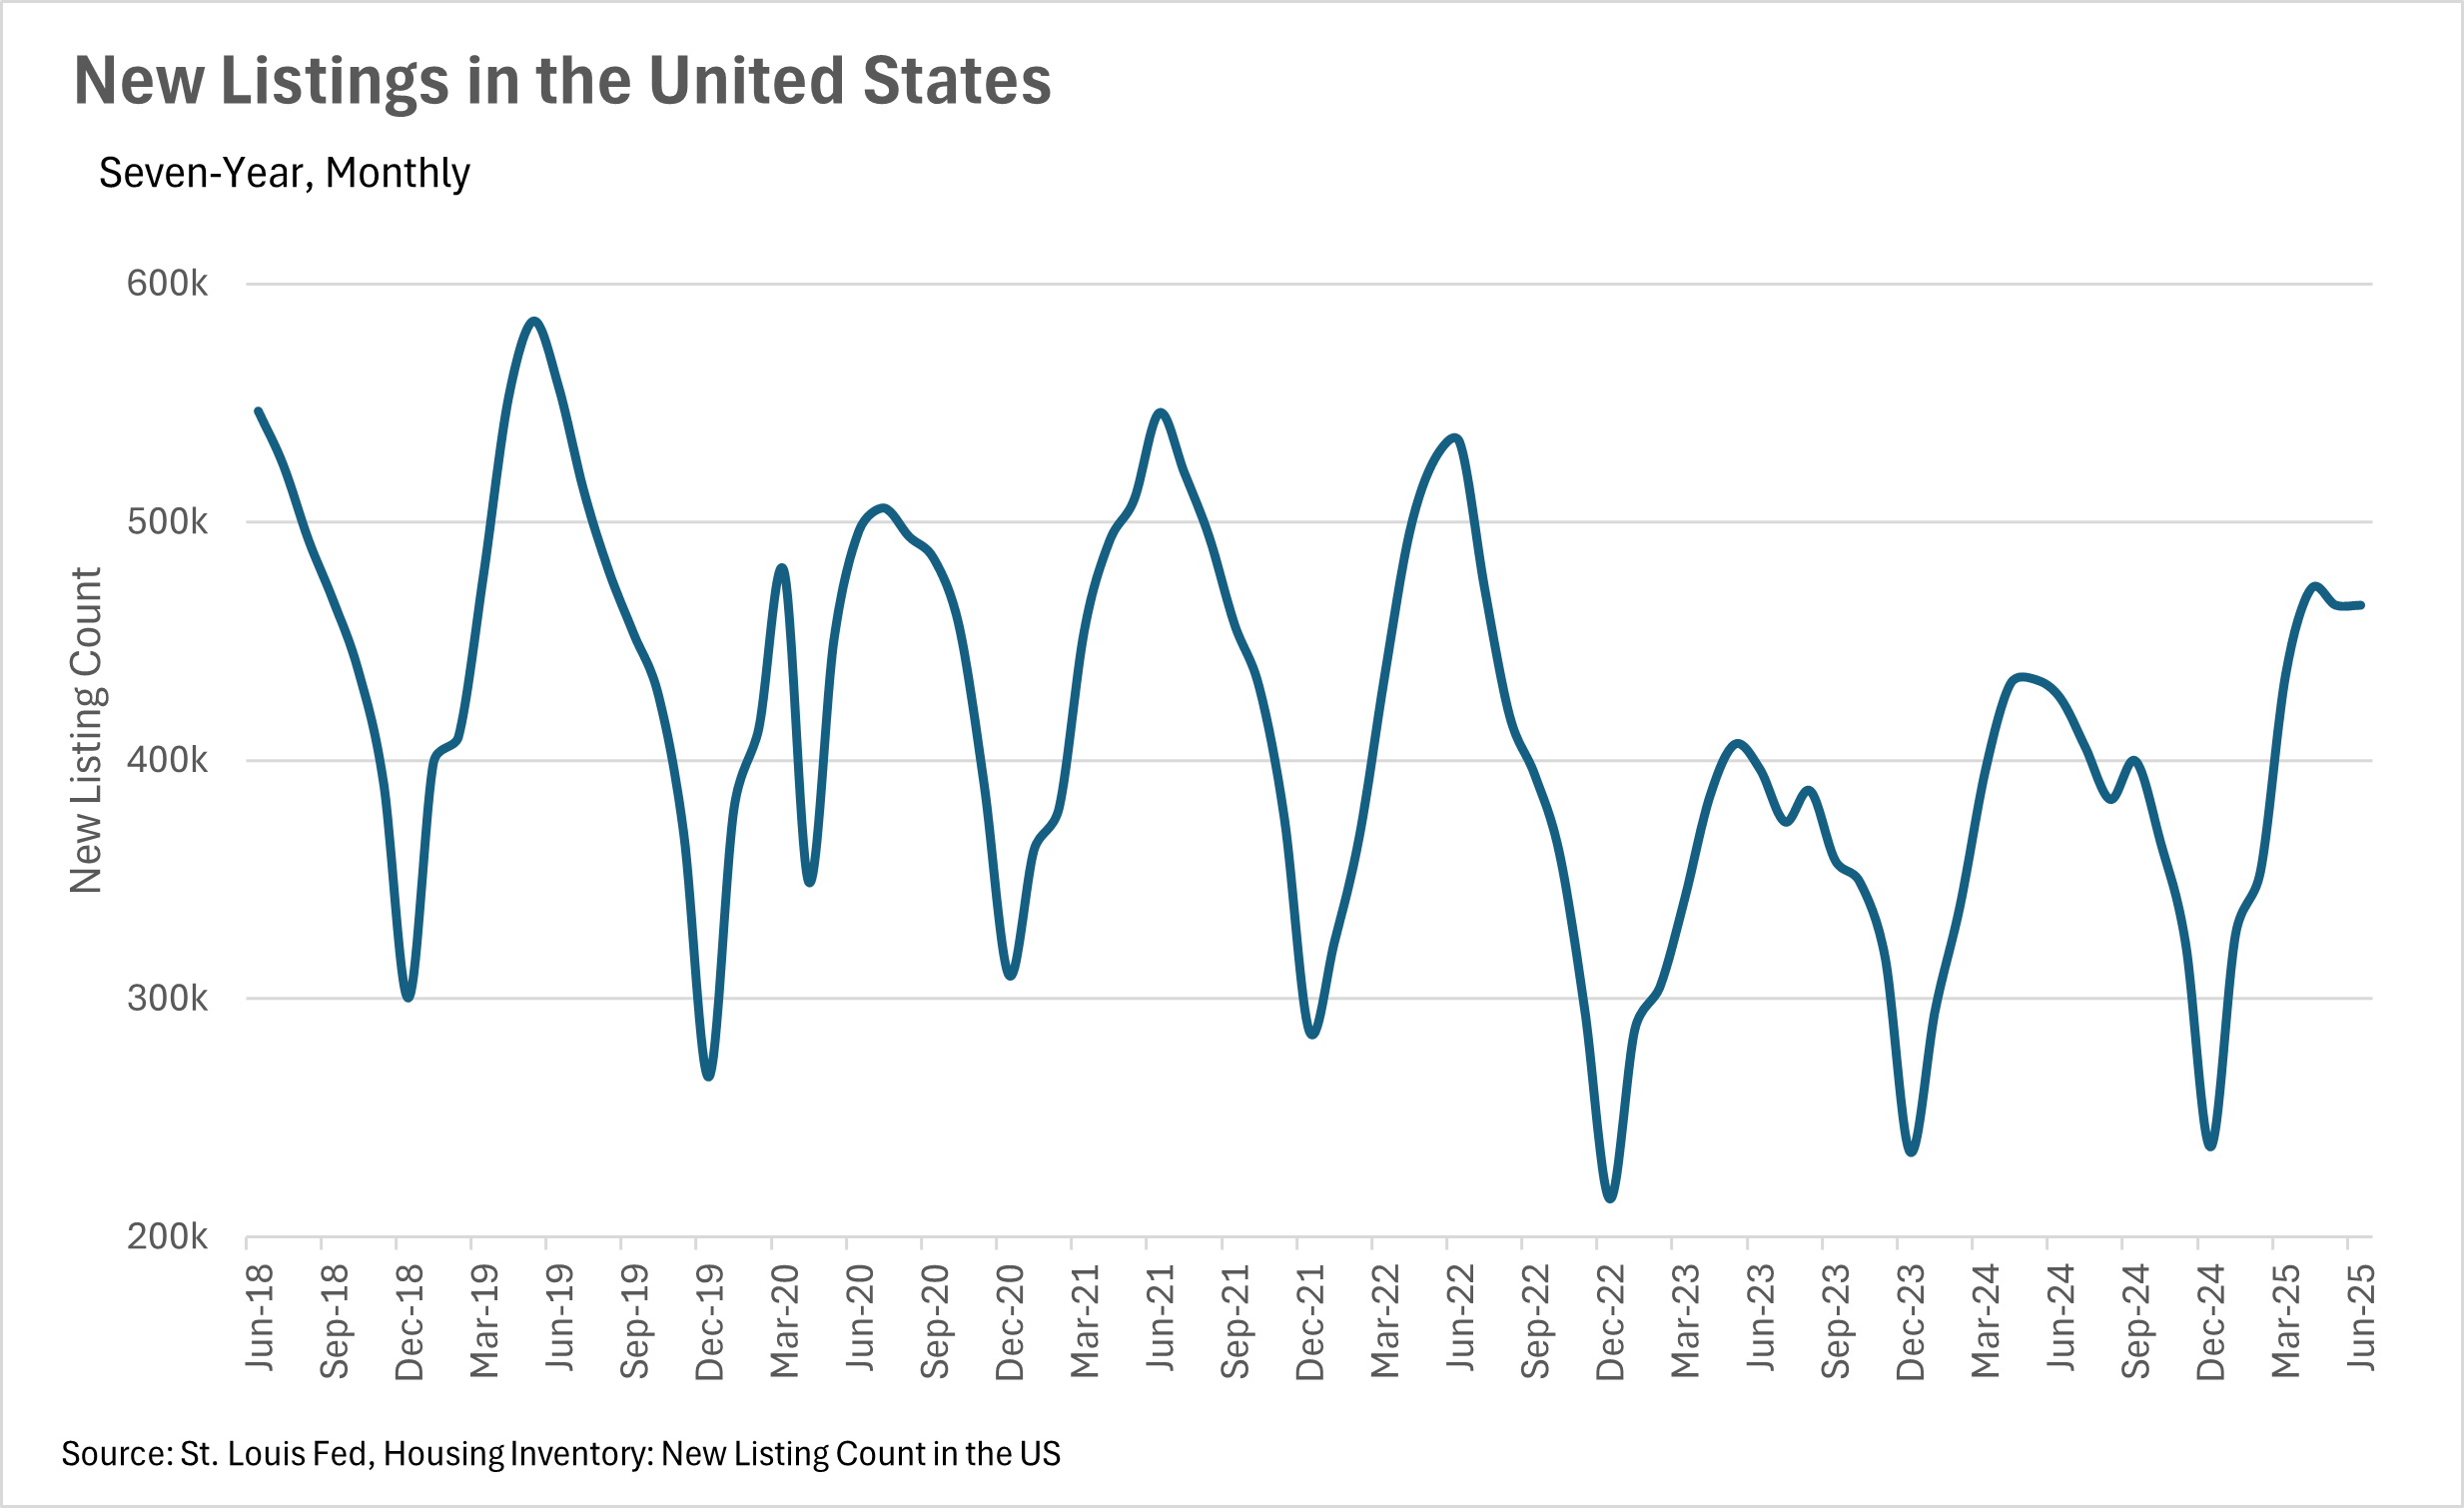
Inventories are building at an incredibly rapid rate
What we have been seeing in terms of inventories in California has been echoed on a nationwide scale. Fewer homes are being sold, with 1.95% fewer existing home sales when compared to this time last year. At the same time, 9.95% more new listings have hit the market on a year-over-year basis. This has led overall inventory to increase by a whopping 20.31% on a year-over-year basis.
As inventories are piling up, negotiating power will slowly shift from the sellers to the buyers, as buyers have more opportunities, and don’t need to move nearly as quickly as they had to just a year earlier.
Global economic and geopolitical instability are making both buyers and sellers more cautious
In any market, but especially the real estate market, instability is incredibly detrimental. Given the recent rise in uncertainty around tariffs and employment, coupled with continued instability in Europe and the Middle East, both buyers and sellers have become much more cautious. Inventories are growing throughout California and the broader United States. However, for those who have the capital and a long time horizon, times like these can represent excellent buying opportunities, as good deals are easier to come by.
However, it’s important to note that this is just what we have been seeing at the national level. California markets have largely remained resilient, which we’ll delve into more in the local lowdown section below.
Big Story Data
The Local Lowdown
Quick Take:
-
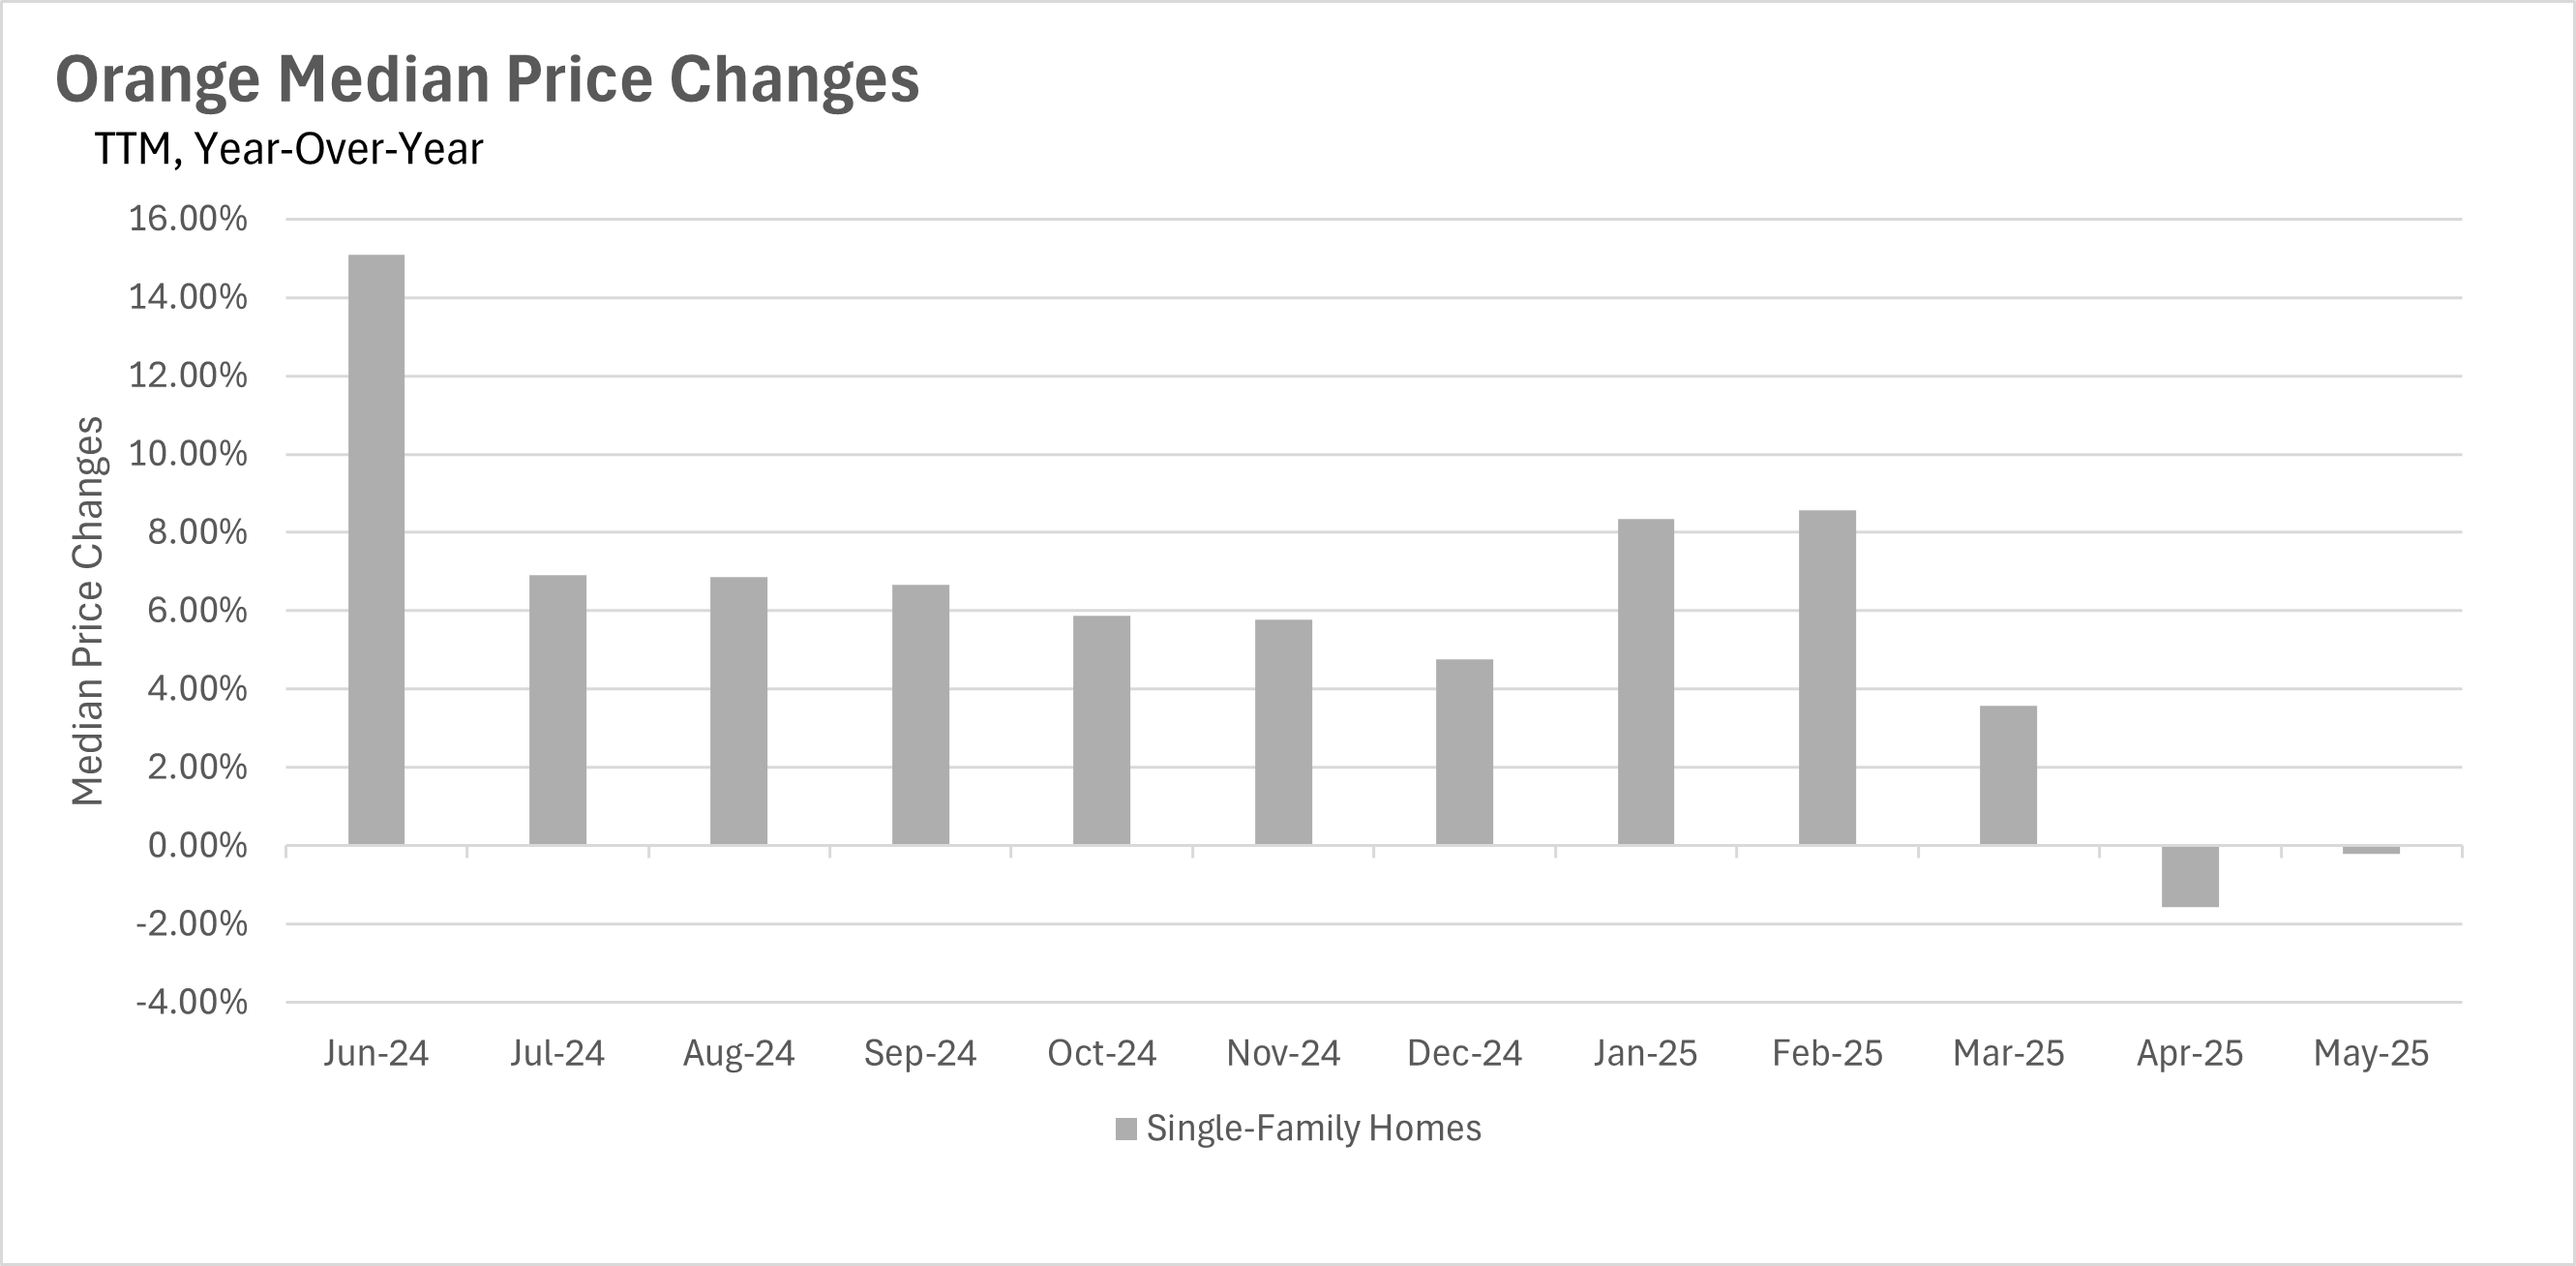
Median sale prices show continued weakness with a modest 0.21% year-over-year decline in May 2025, marking the second consecutive month of negative growth.
-
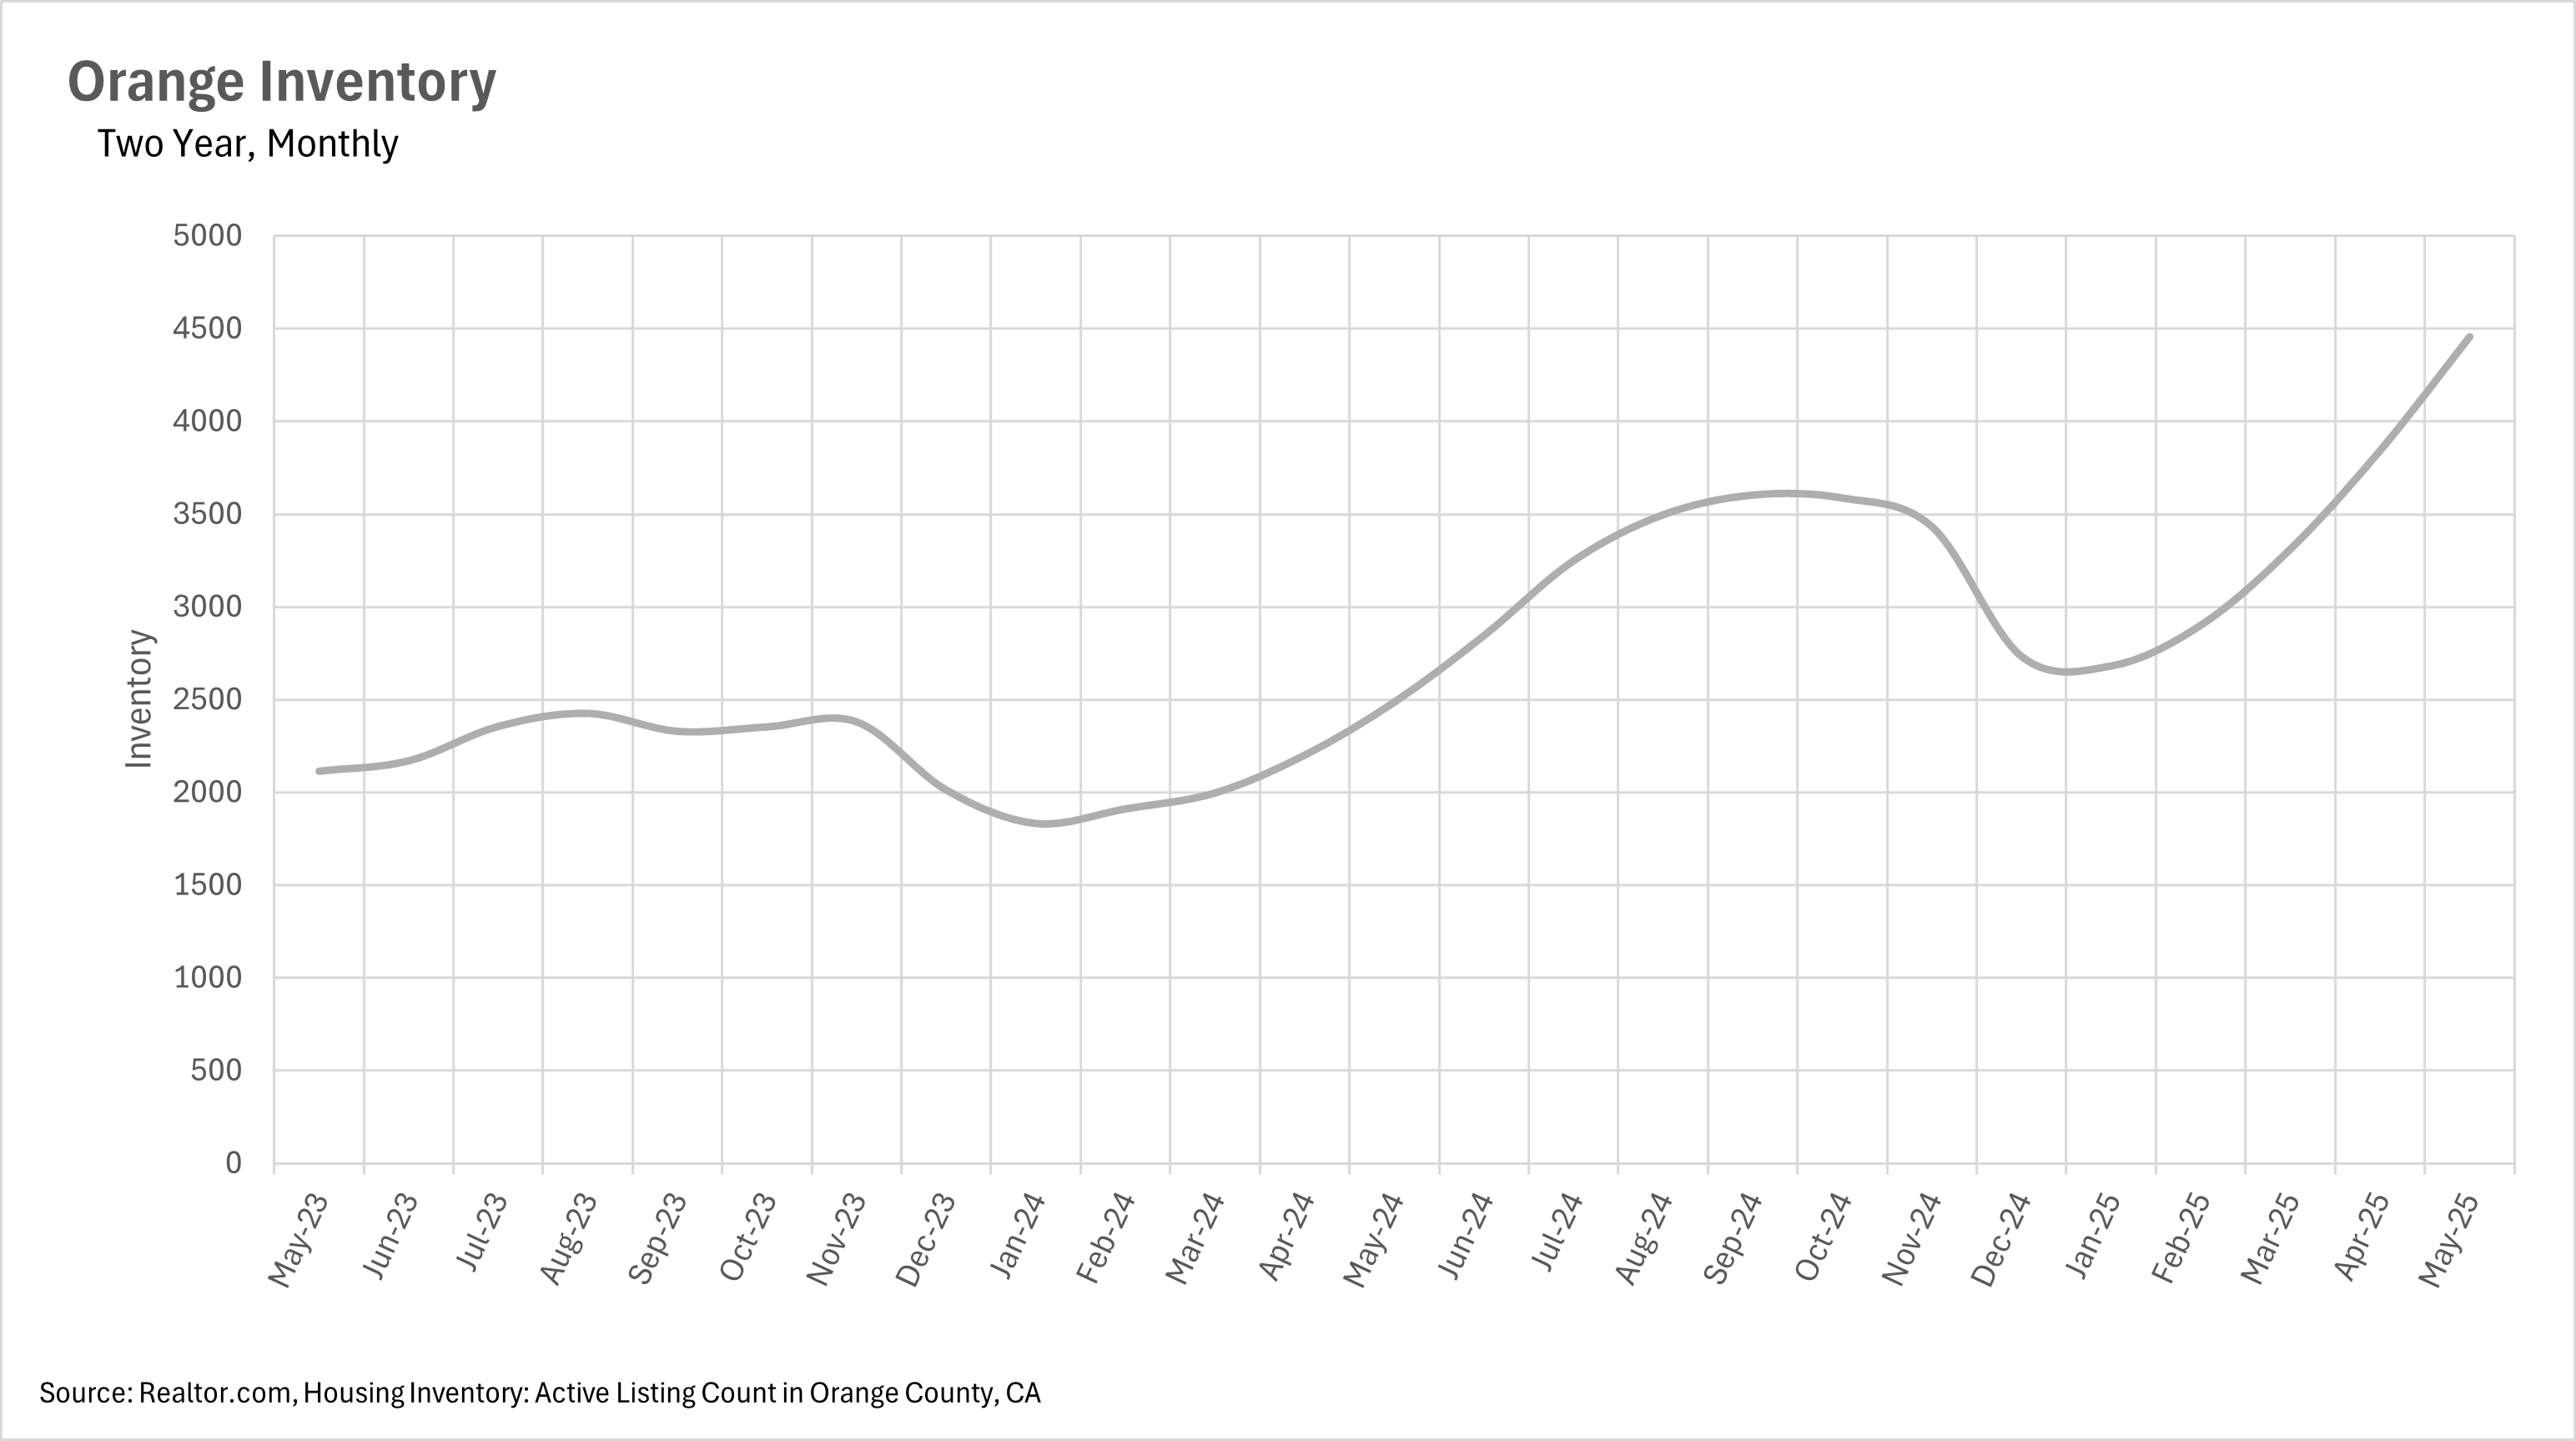
Inventory levels maintain their explosive growth trajectory with single-family home inventory showing a massive 79.28% year-over-year increase in May.
-
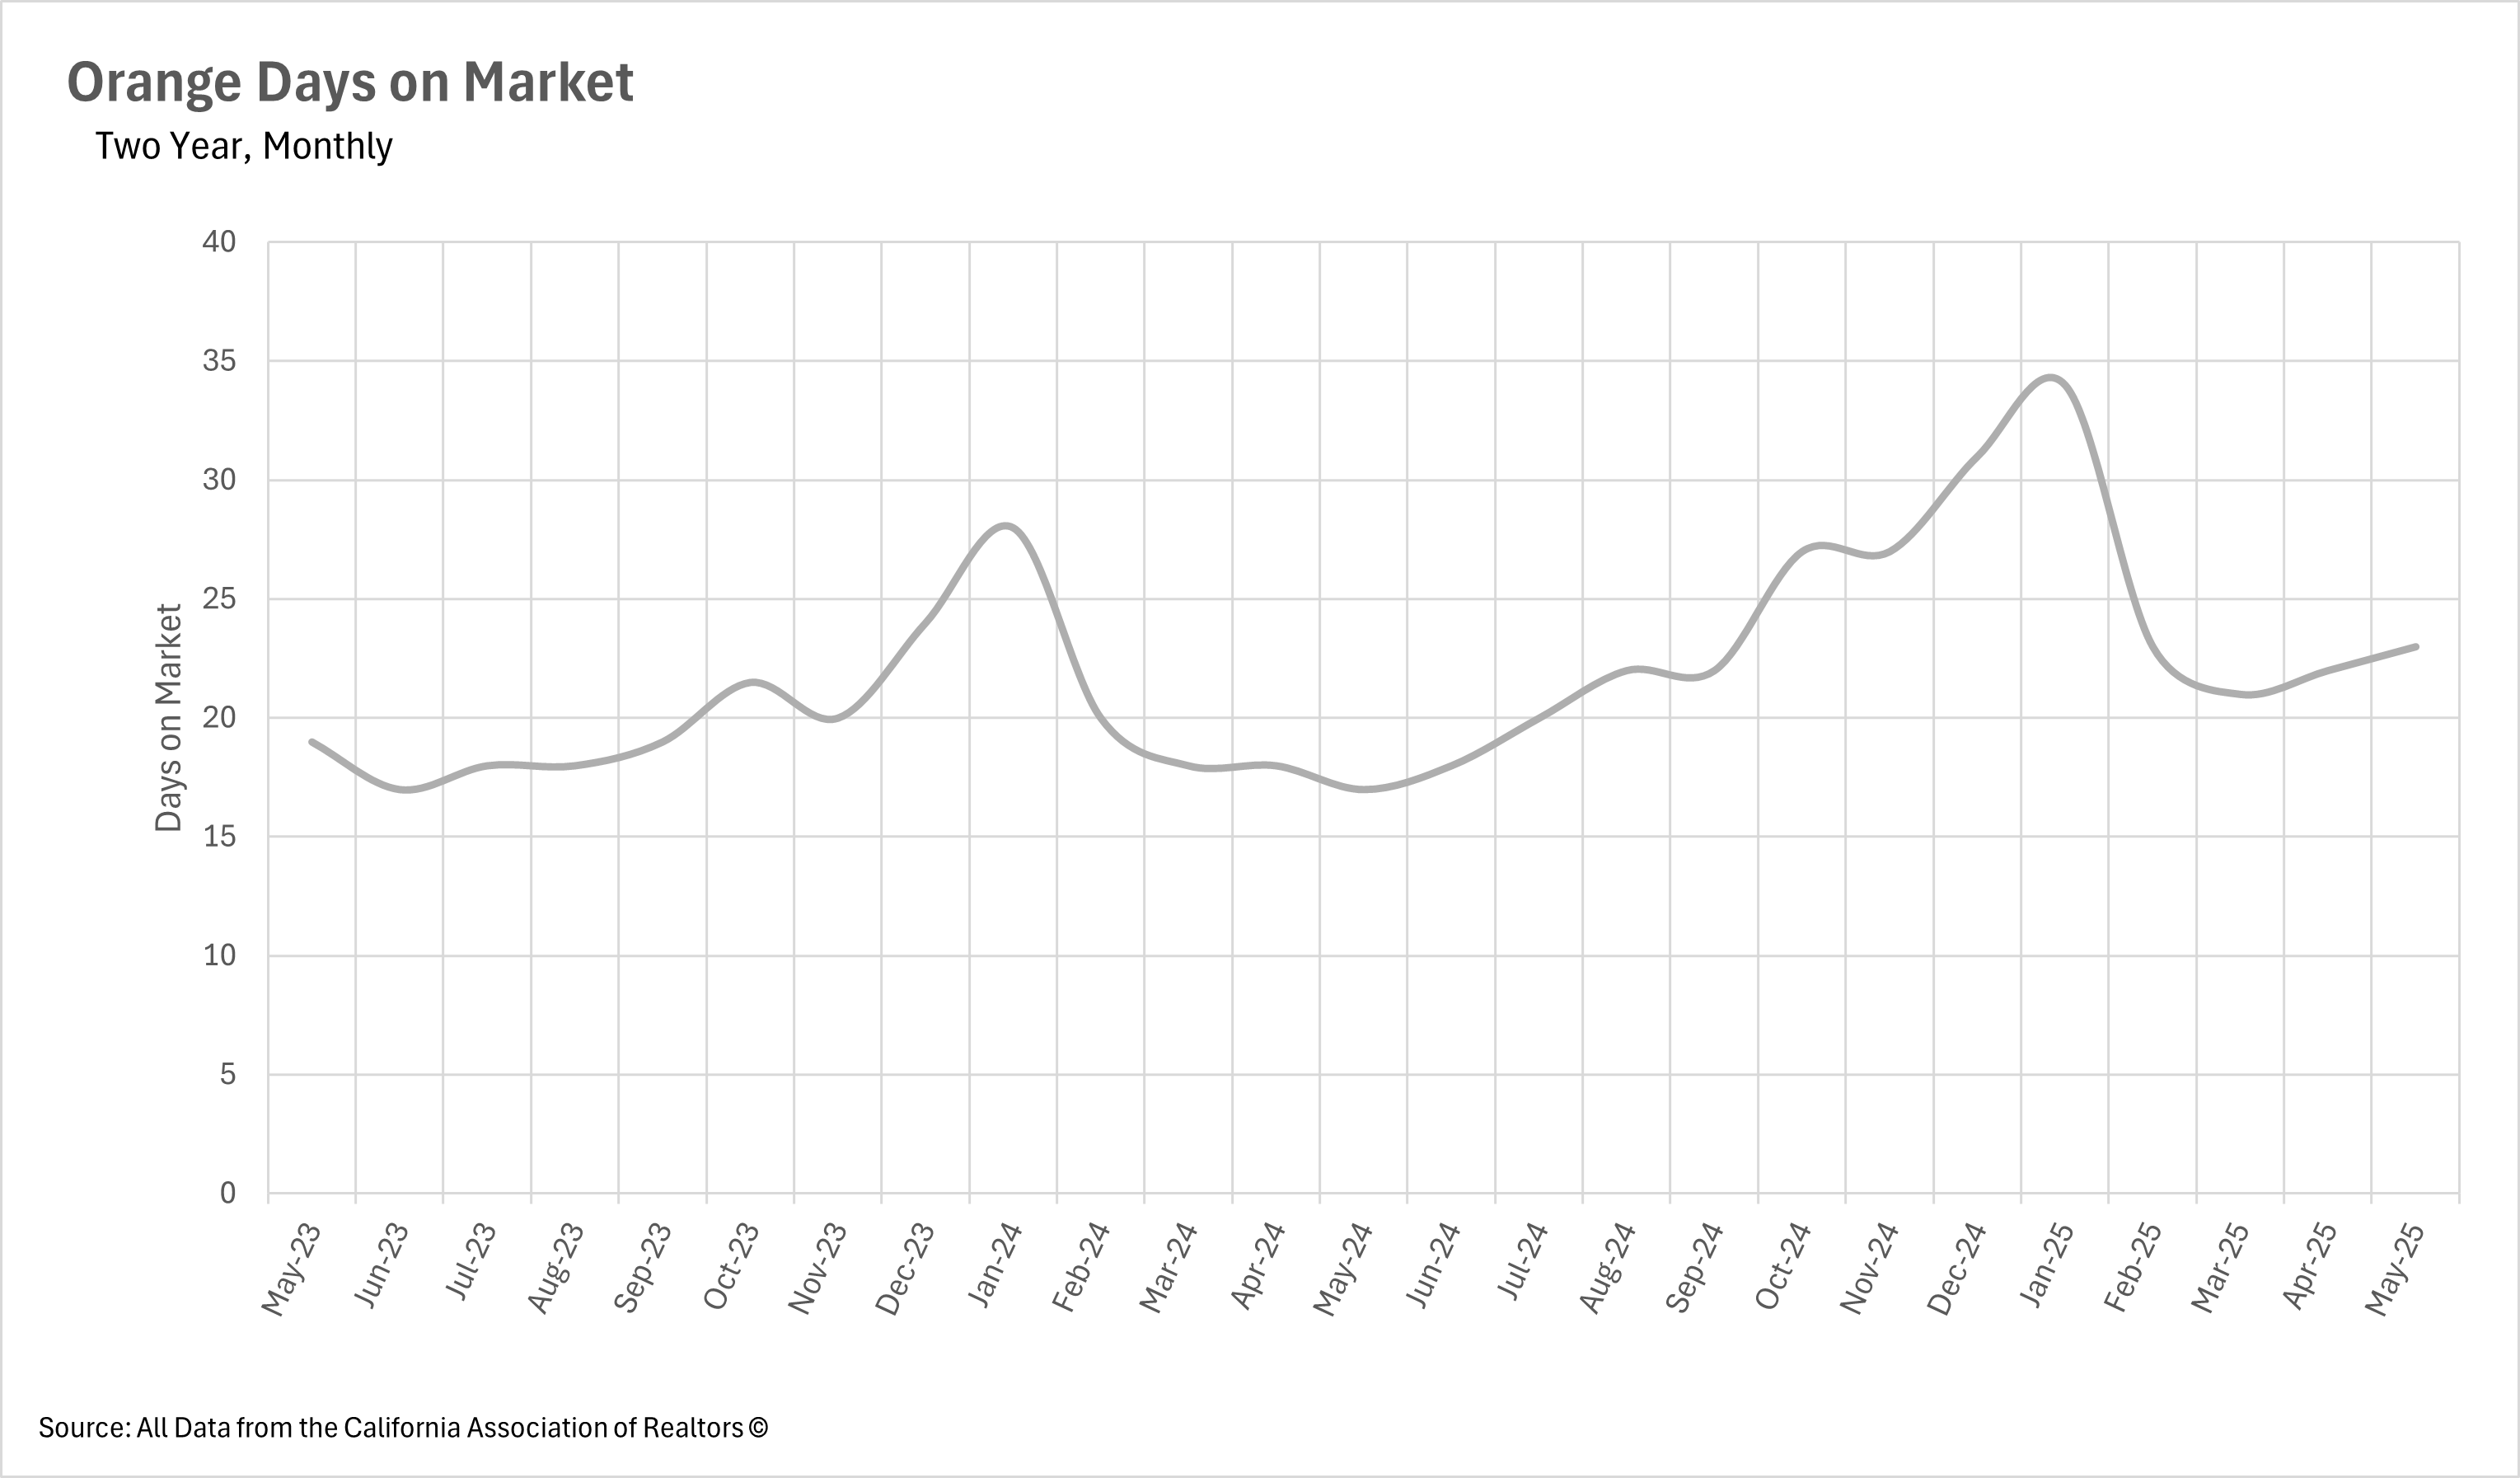
The median listing is now spending 23 days on the market, representing a 35.29% increase compared to the same time last year.
Note: You can find the charts/graphs for the Local Lowdown at the end of this section.
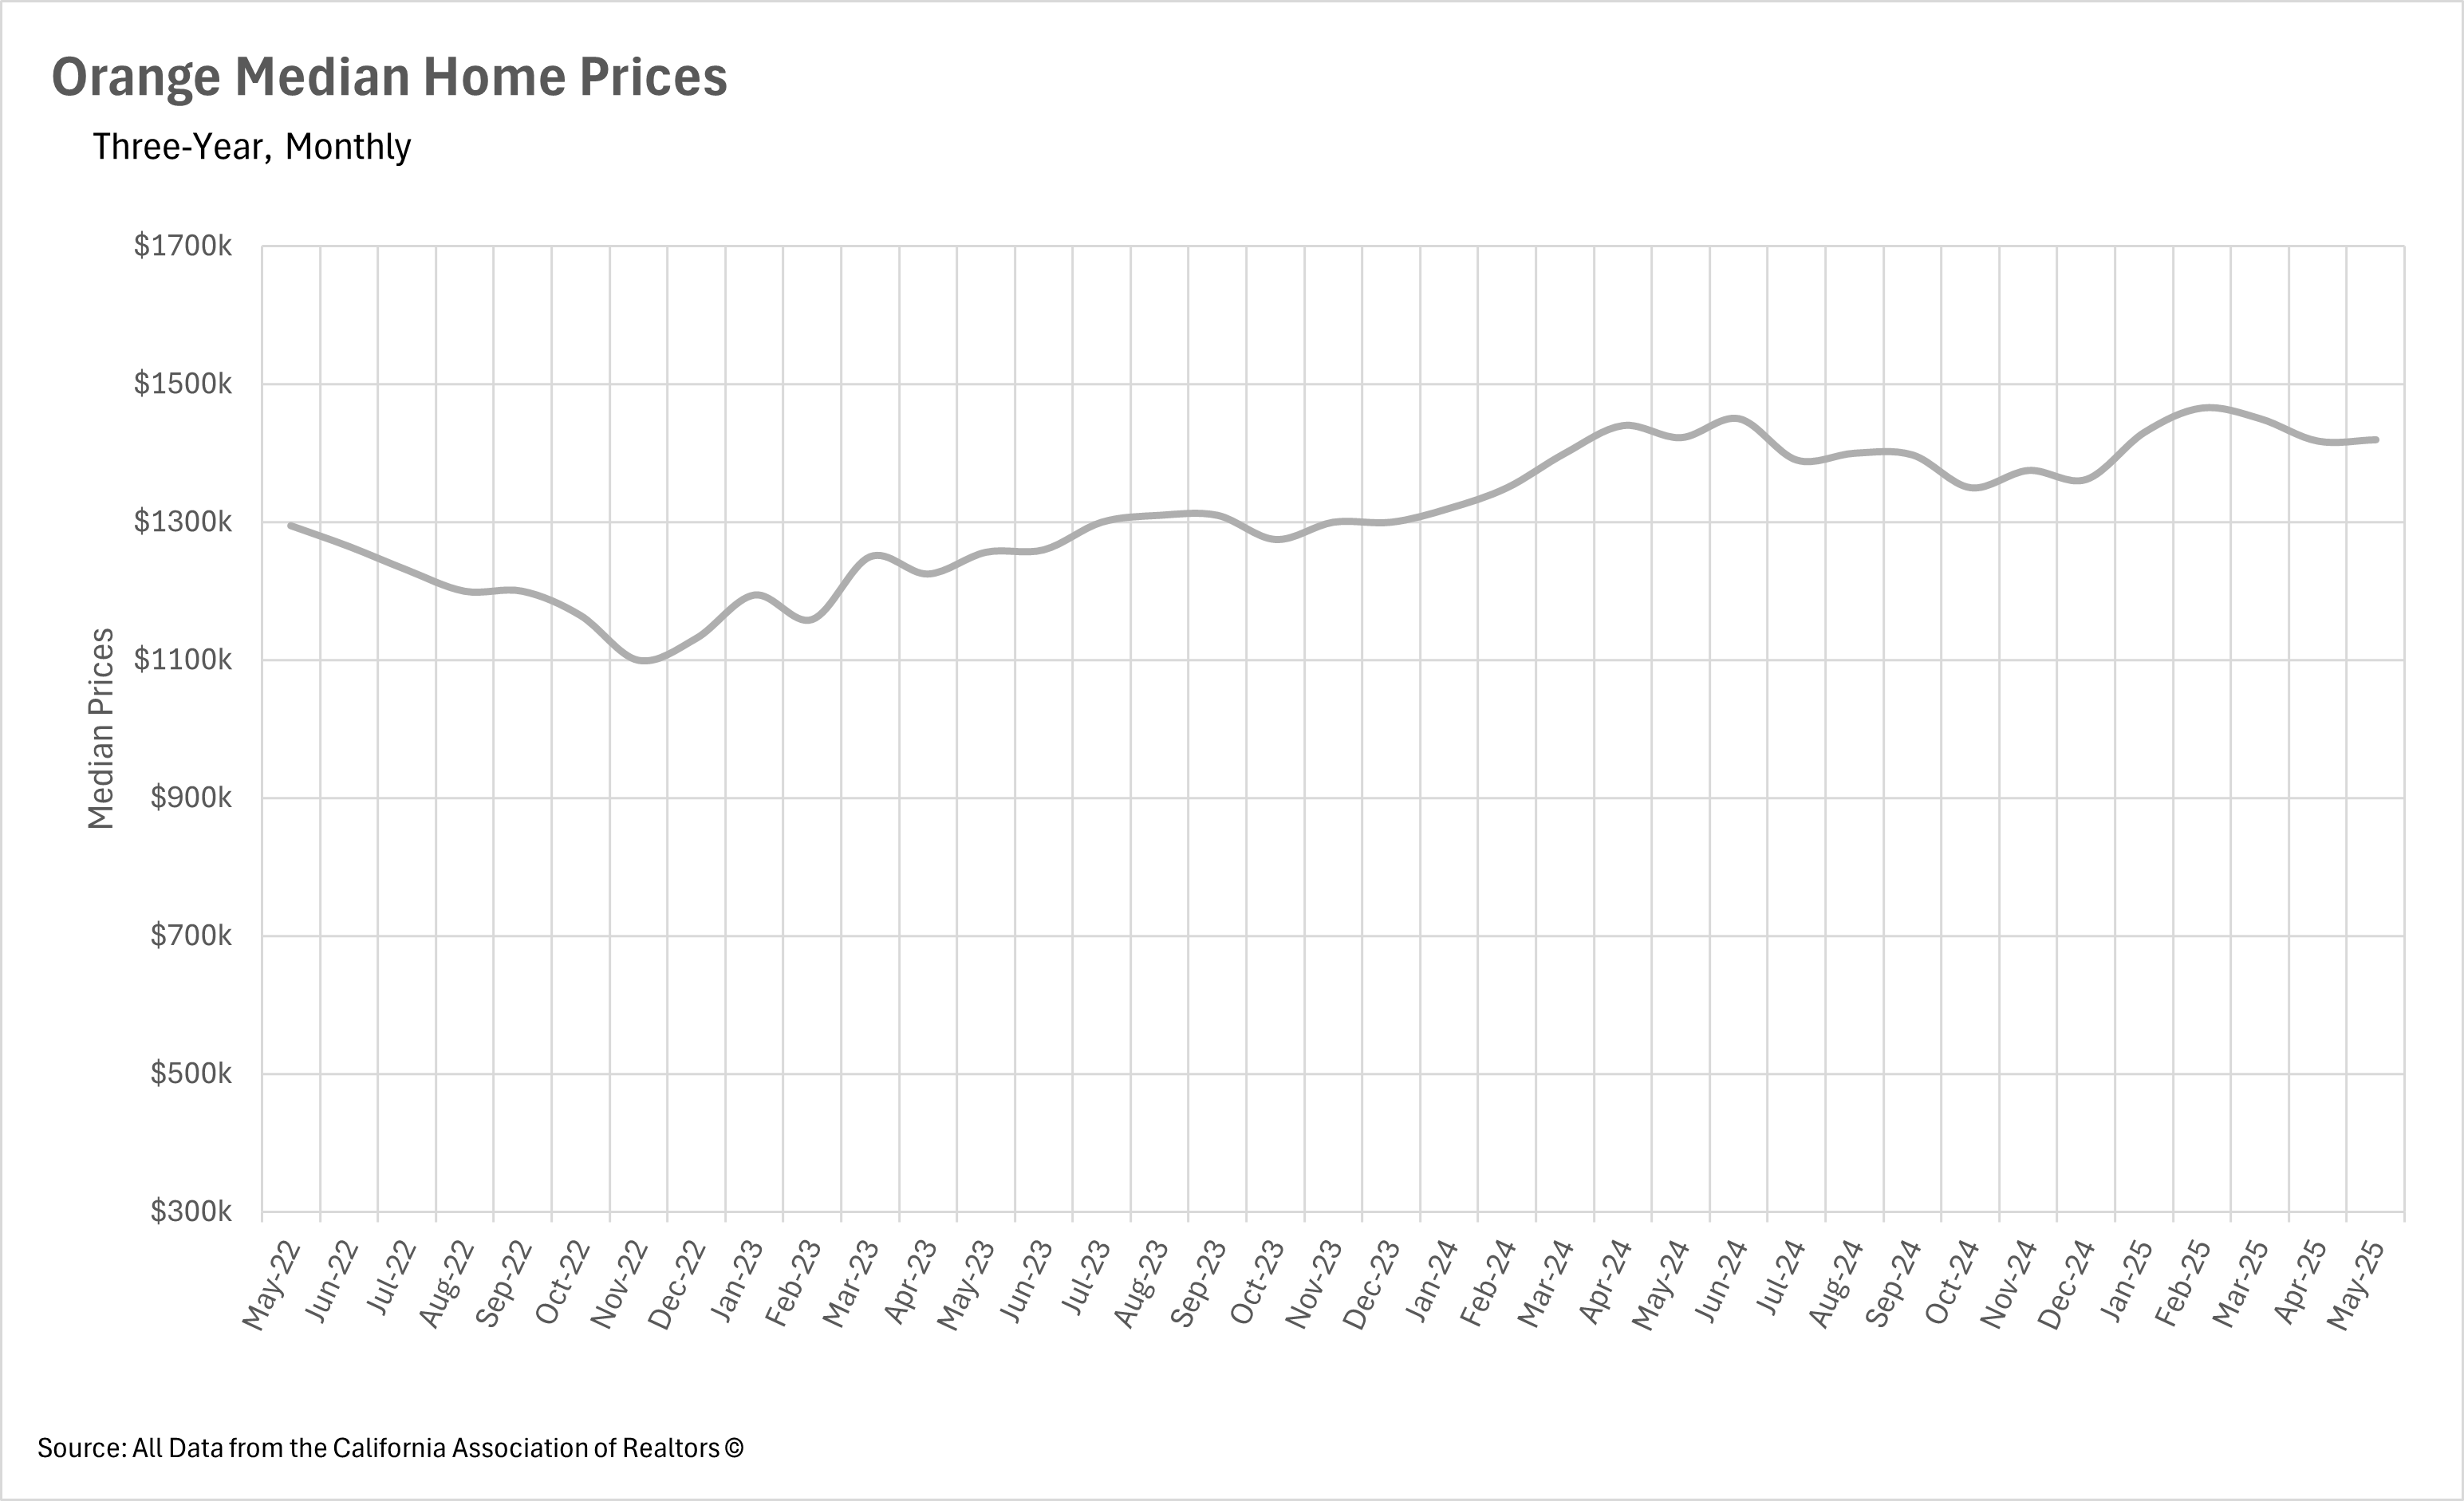
Orange County's Price Decline Continues Into Second Month
Orange County's housing market continues to experience a notable shift in pricing dynamics. May 2025 saw the median single-family home selling for $1,419,500, representing a 0.21% decrease compared to May 2024's $1,422,500. While this decline is smaller than April's 1.57% year-over-year drop, it marks the second consecutive month of negative price growth - a significant departure from the consistent appreciation we witnessed throughout 2024 and early 2025. The median price also showed a slight month-over-month increase of 0.14% from April's $1,417,450, suggesting that while year-over-year comparisons remain challenging, there may be some stabilization occurring at current price levels.
Inventory Explosion Reaches New Heights as Market Floods With Options
The Orange County housing market continues to be dominated by an unprecedented surge in available inventory. The latest data for May 2025 shows 4,457 single-family homes on the market, maintaining the staggering 79.28% increase compared to May 2024. This represents a continued month-over-month growth of 15.98% from April's 3,843 homes, demonstrating that the inventory buildup shows no signs of slowing down. This dramatic increase in available properties has fundamentally altered the market landscape, providing buyers with an abundance of choices and significantly shifting the balance of power in negotiations. The sustained inventory growth throughout the spring selling season indicates that supply is far outpacing demand in the current market environment.
Buyers Take Their Time as Market Pace Continues to Slow
With the massive influx of inventory, buyers are clearly capitalizing on their improved position by taking more time with their purchasing decisions. The median single-family home in Orange County now sits on the market for 23 days before selling, representing a substantial 35.29% increase from May 2024's 17 days. This also reflects a 4.55% month-over-month increase from April's 22-day average, indicating that the trend toward longer selling times is accelerating rather than stabilizing. This extended timeline gives buyers the luxury of being highly selective and methodical in their home search process, a stark contrast to the rapid-fire market conditions that characterized previous years when multiple offers and quick decisions were the norm.
Orange County Shifts Toward a Buyers' Market
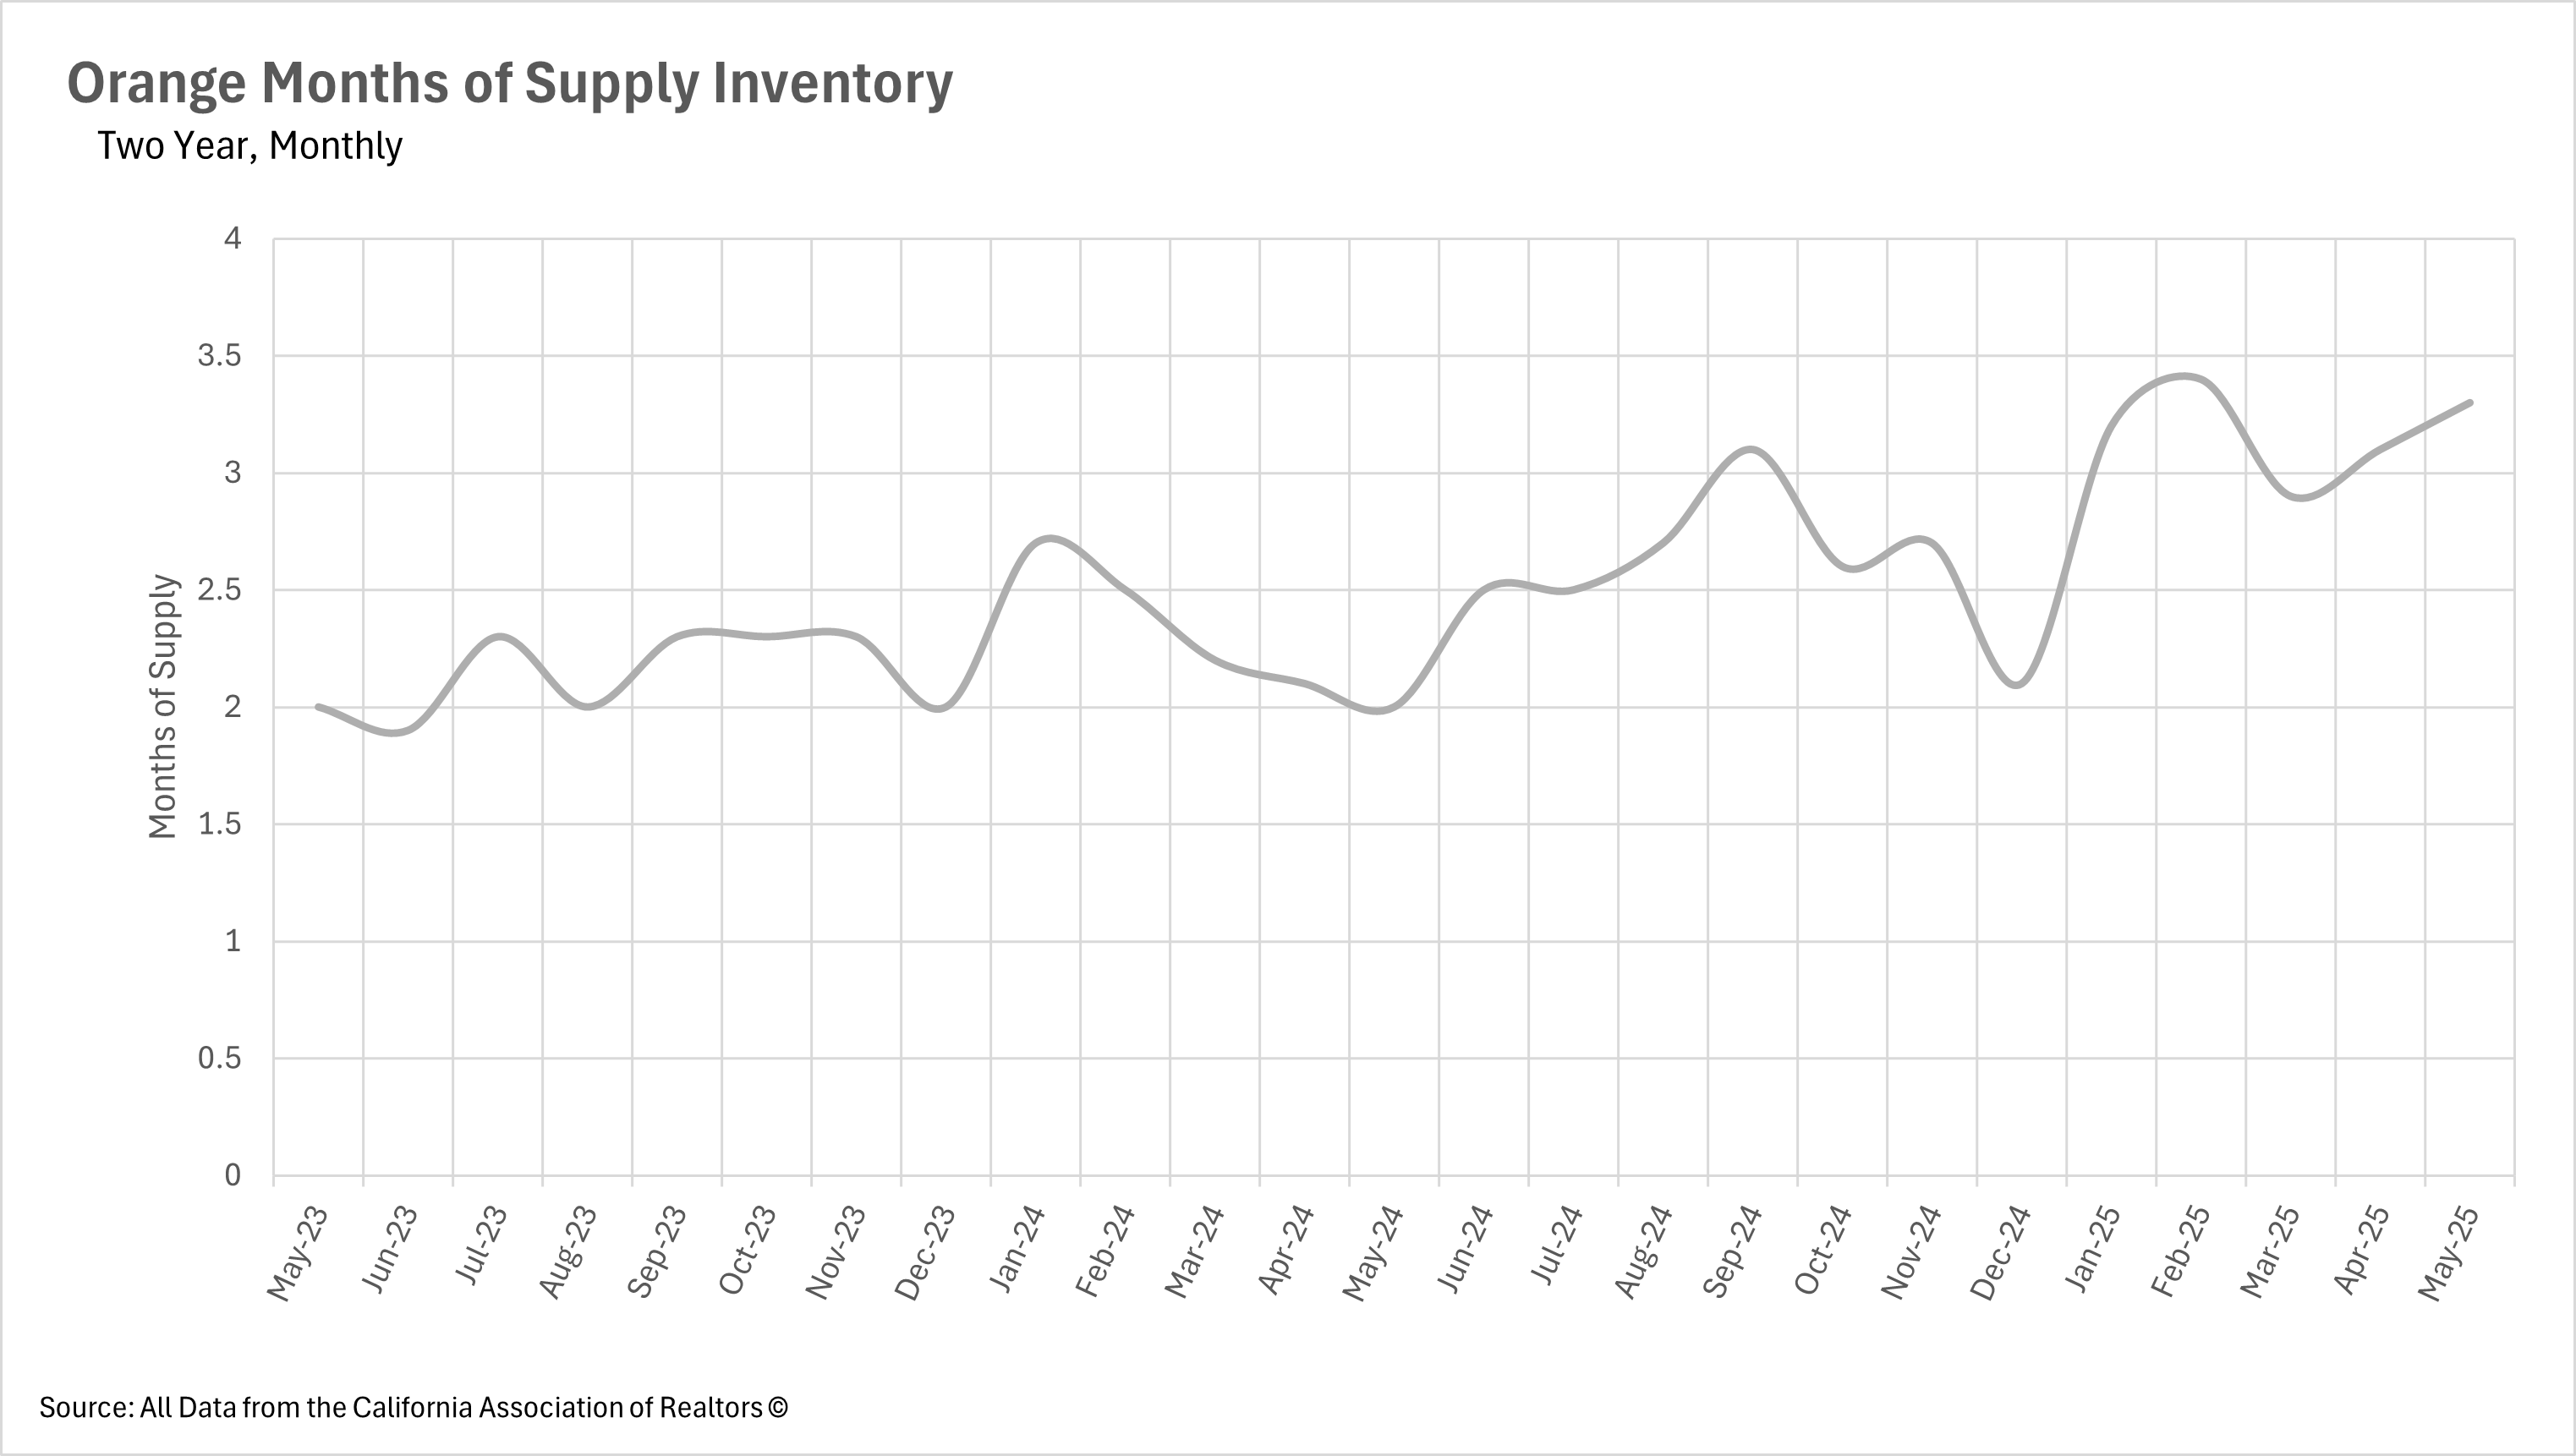
When determining whether a market is a buyers' market or a sellers' market, we look to the Months of Supply Inventory (MSI) metric. The state of California has historically averaged around three months of MSI, so any area with at or around three months of MSI is considered a balanced market. Any market that has lower than three months of MSI is considered a sellers' market, whereas markets with more than three months of MSI are considered buyers' markets.
With 3.3 months of supply inventory in May 2025, Orange County has now crossed into buyers' market territory for the first time in recent memory. This represents a 6.45% month-over-month increase from April's 3.1 months and a dramatic 65% year-over-year increase from May 2024's 2.0 months of supply. The sustained growth in inventory levels, combined with the corresponding decline in pricing power, clearly indicates that buyers now hold the advantage in negotiations. This shift represents a fundamental change in market dynamics that sellers need to acknowledge as they adjust their expectations for both pricing and timeline in the current environment.