The Big Story
Quick Take:
-
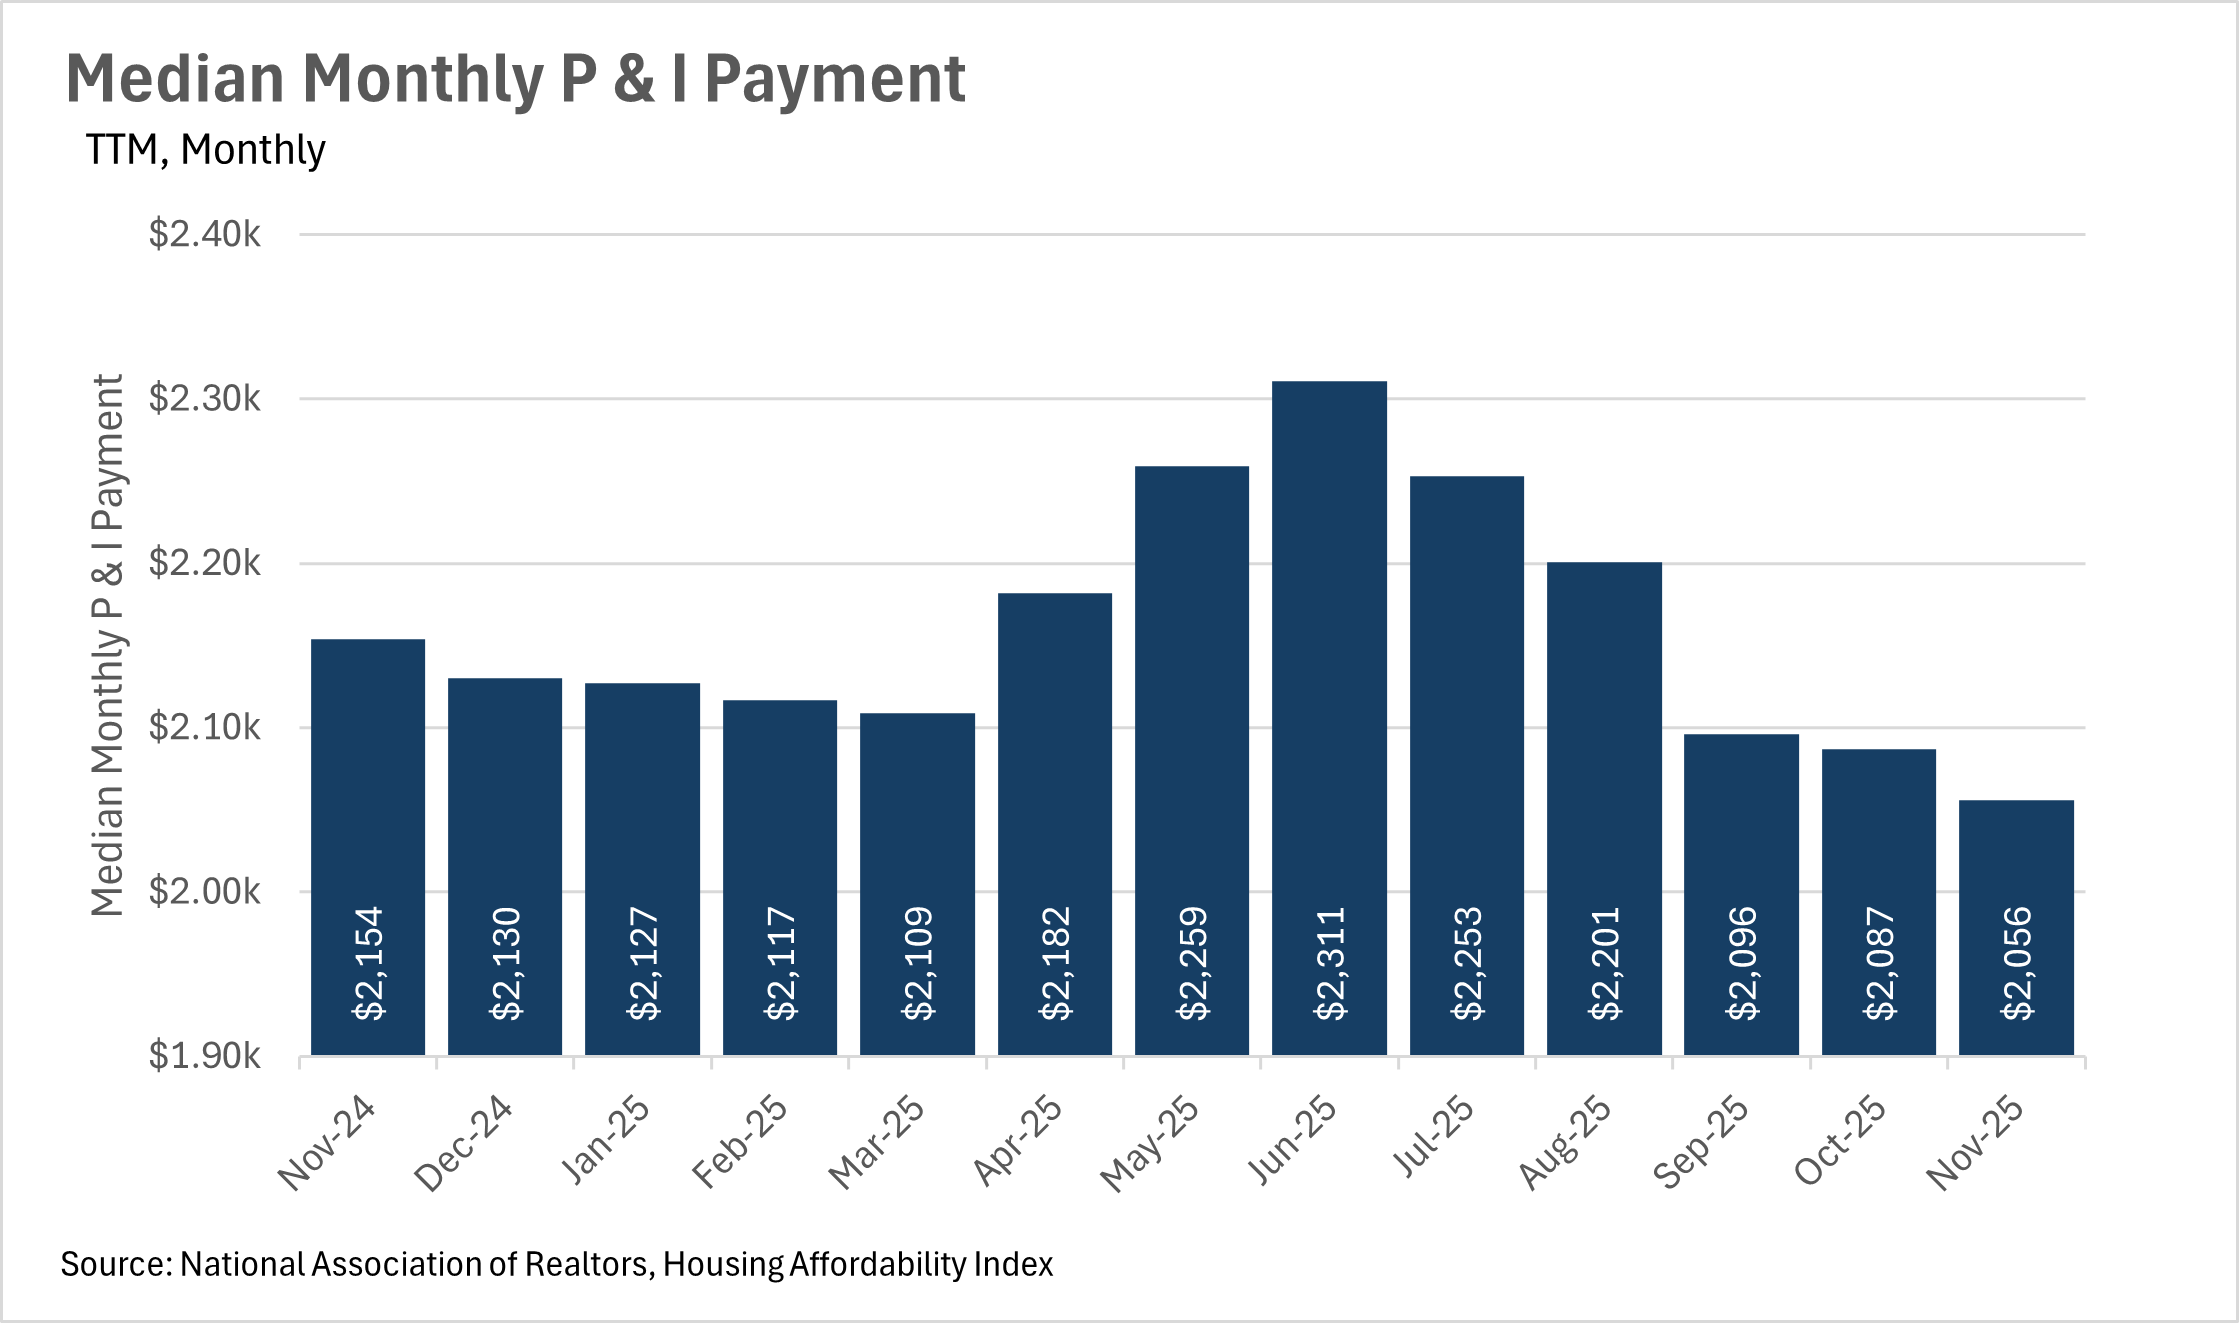
As interest rates continue to fall, median monthly P&I payments do as well, making housing slowly but surely more affordable on a national scale.
-
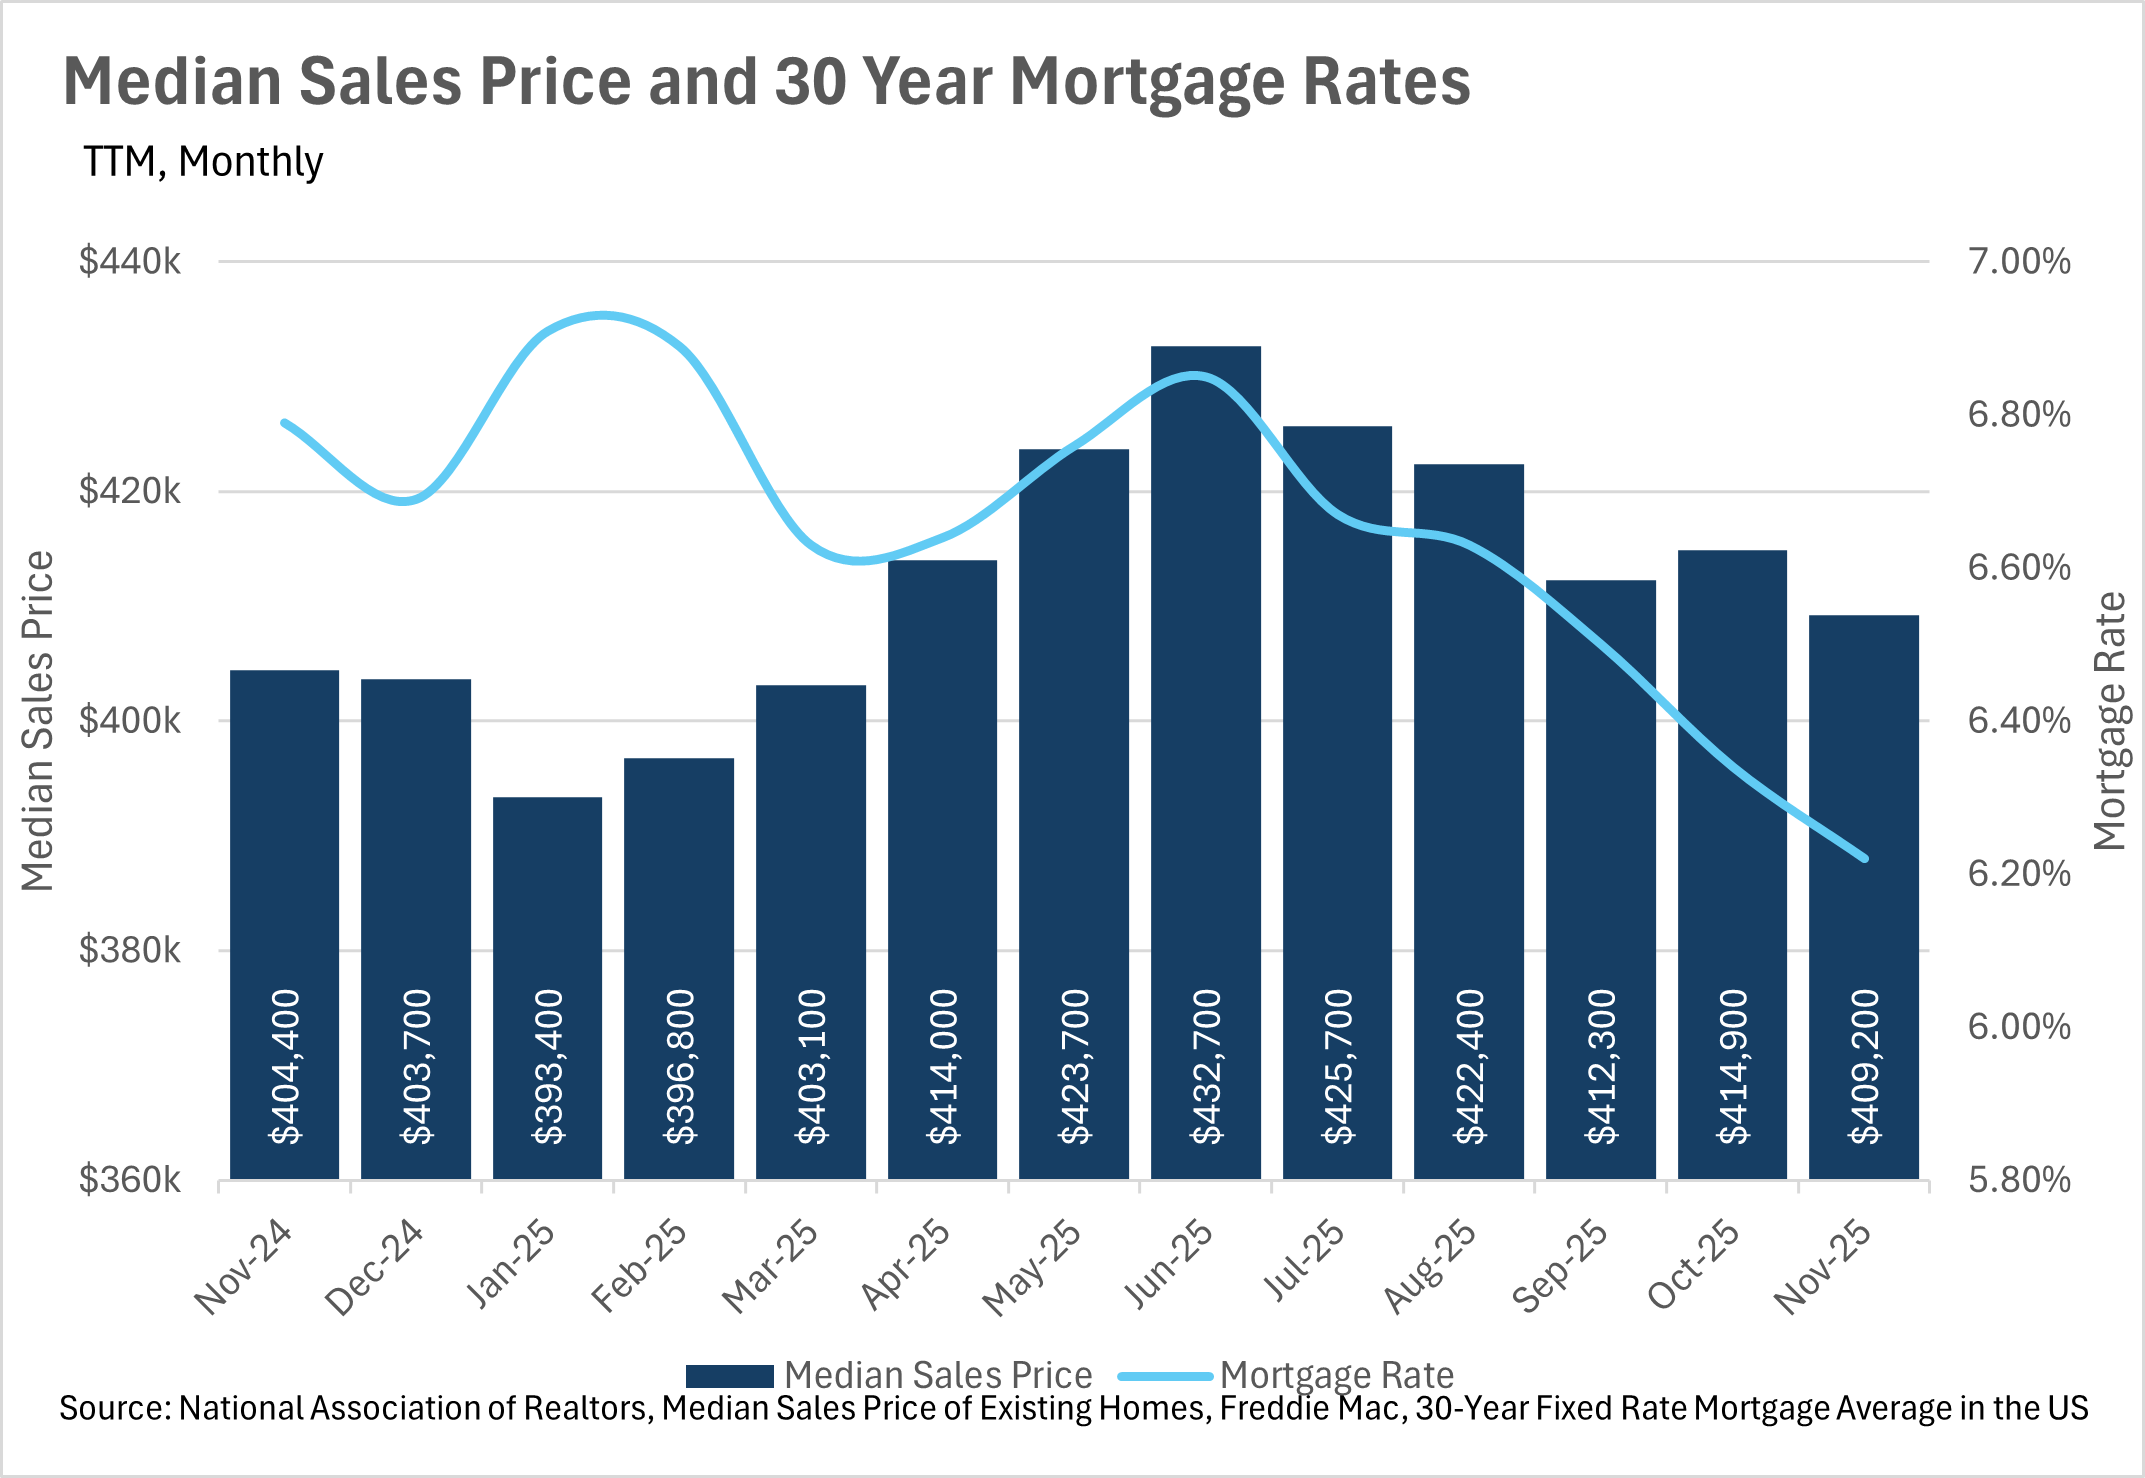
Mortgage rates are currently at the lowest point they’ve been at in recent years, as the Fed continues its rate cut cycle.
-
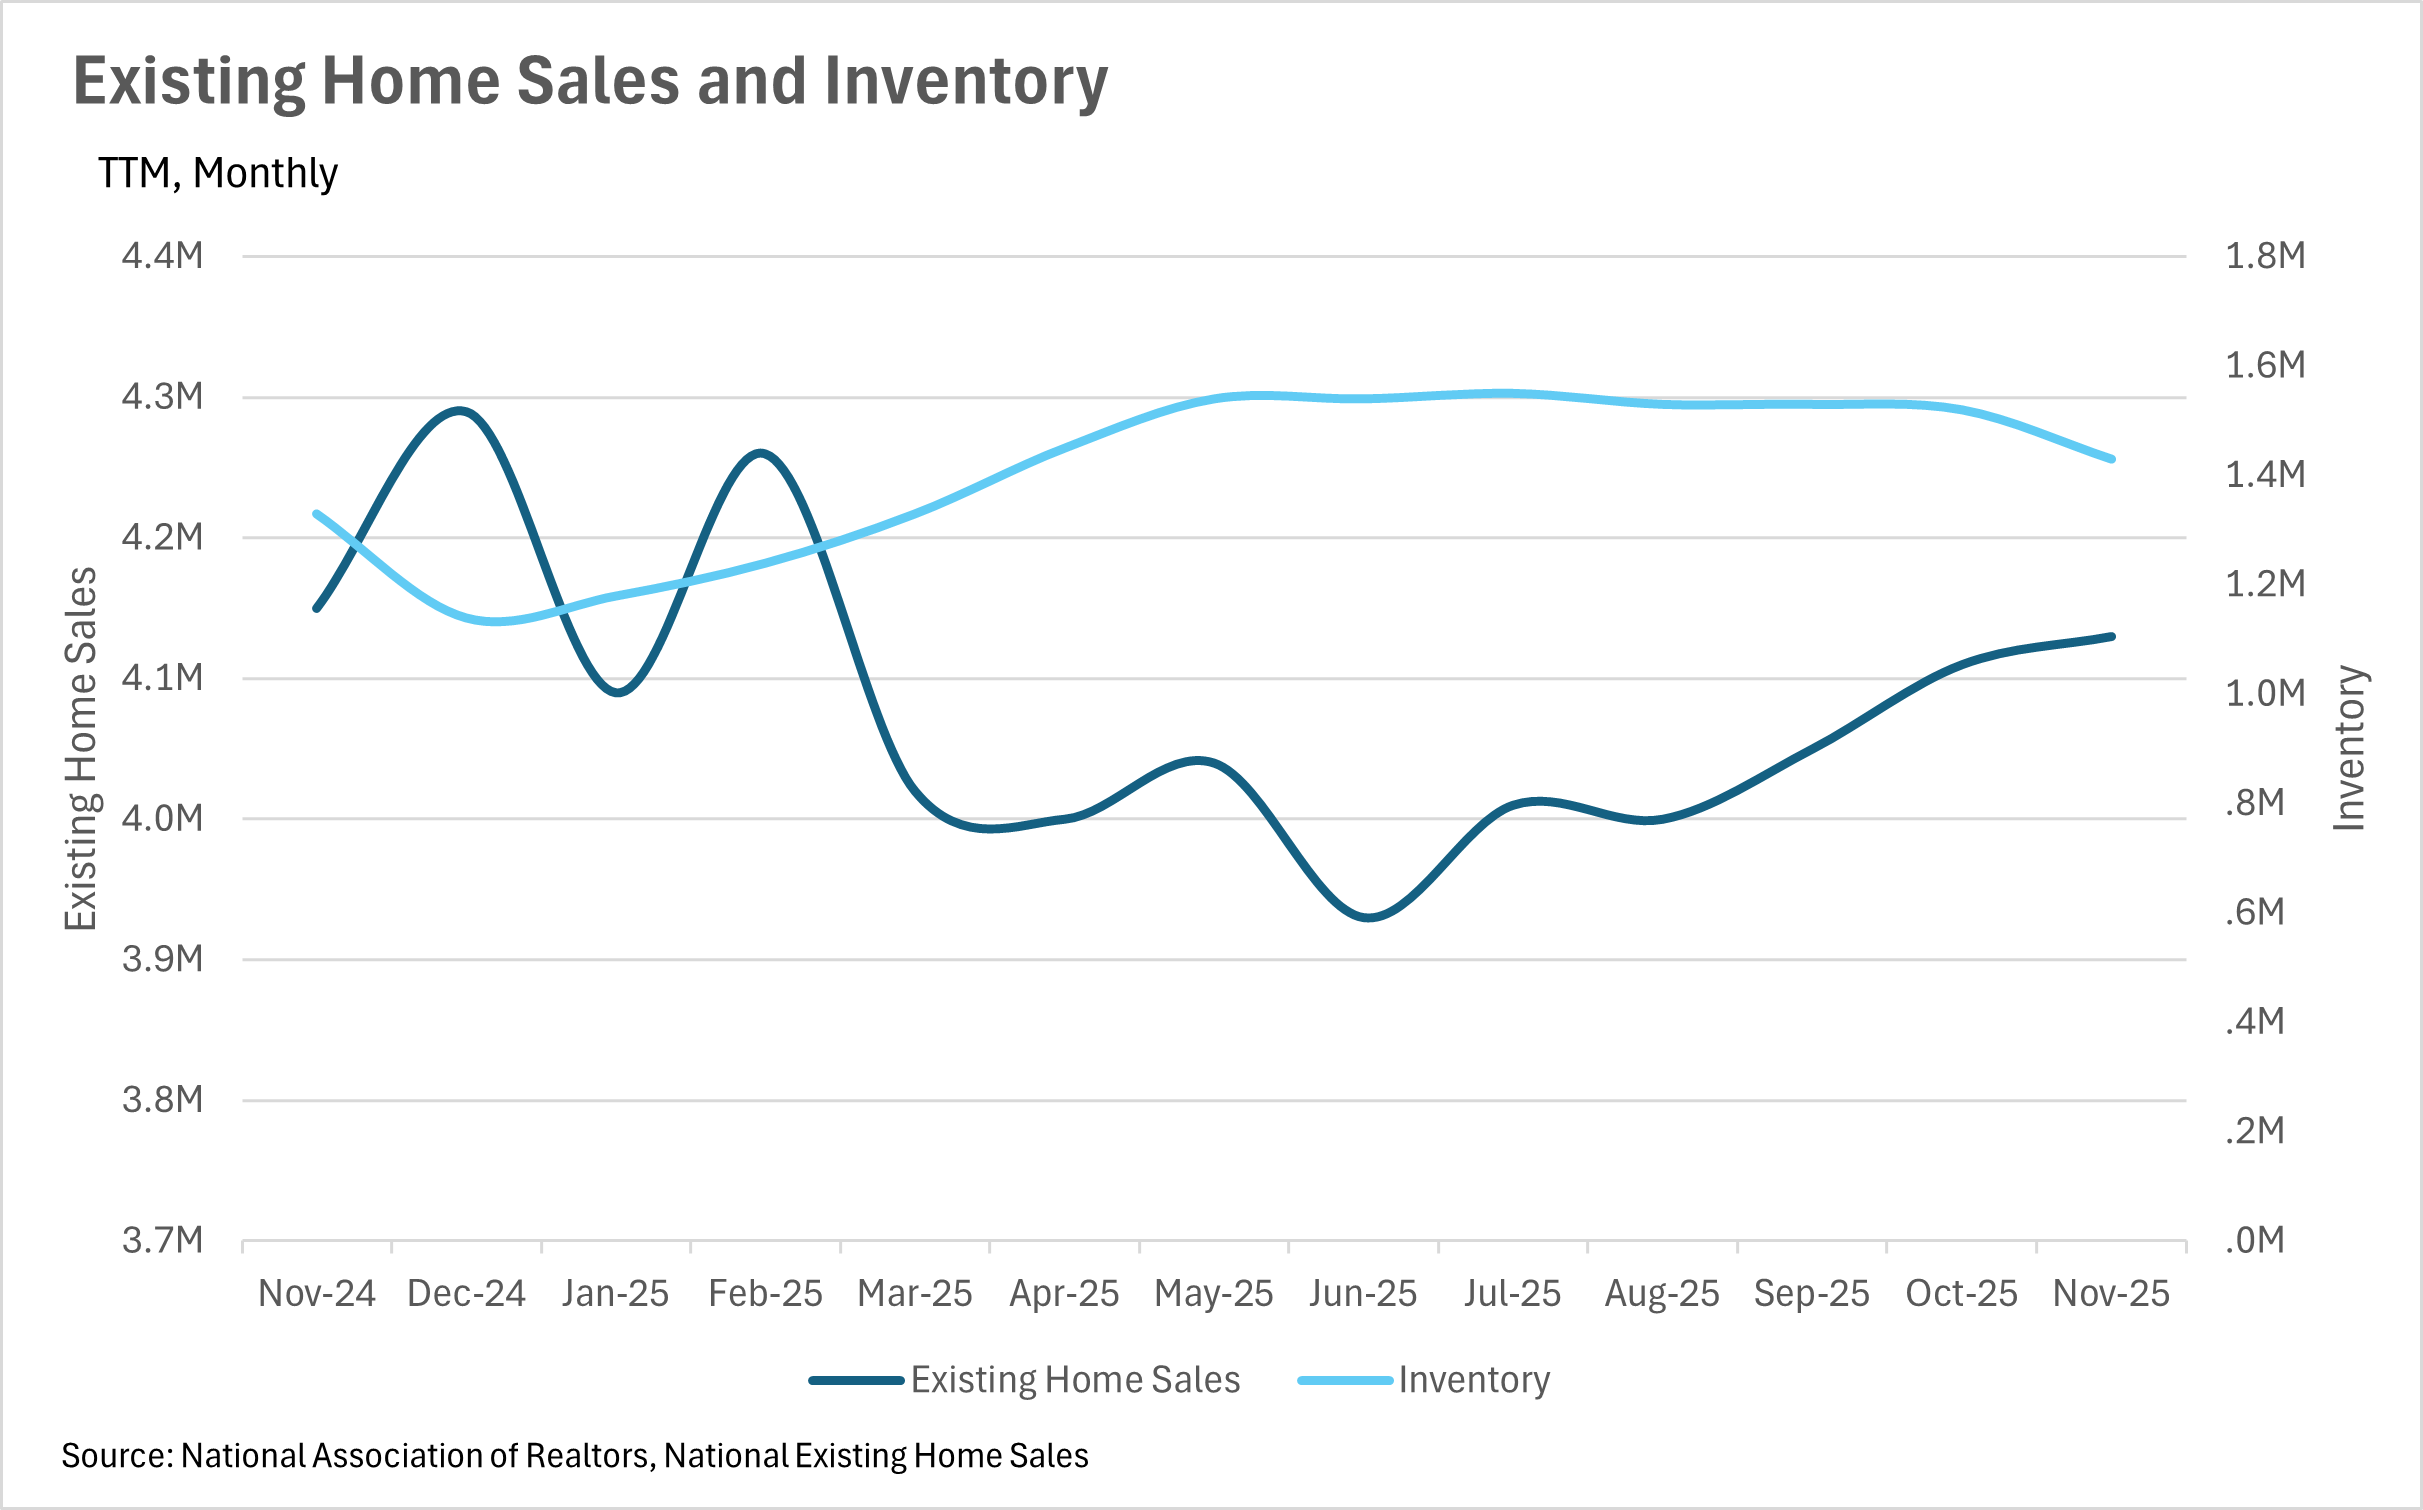
Despite falling interest rates, inventories still remain higher than they were at this point last year.
-
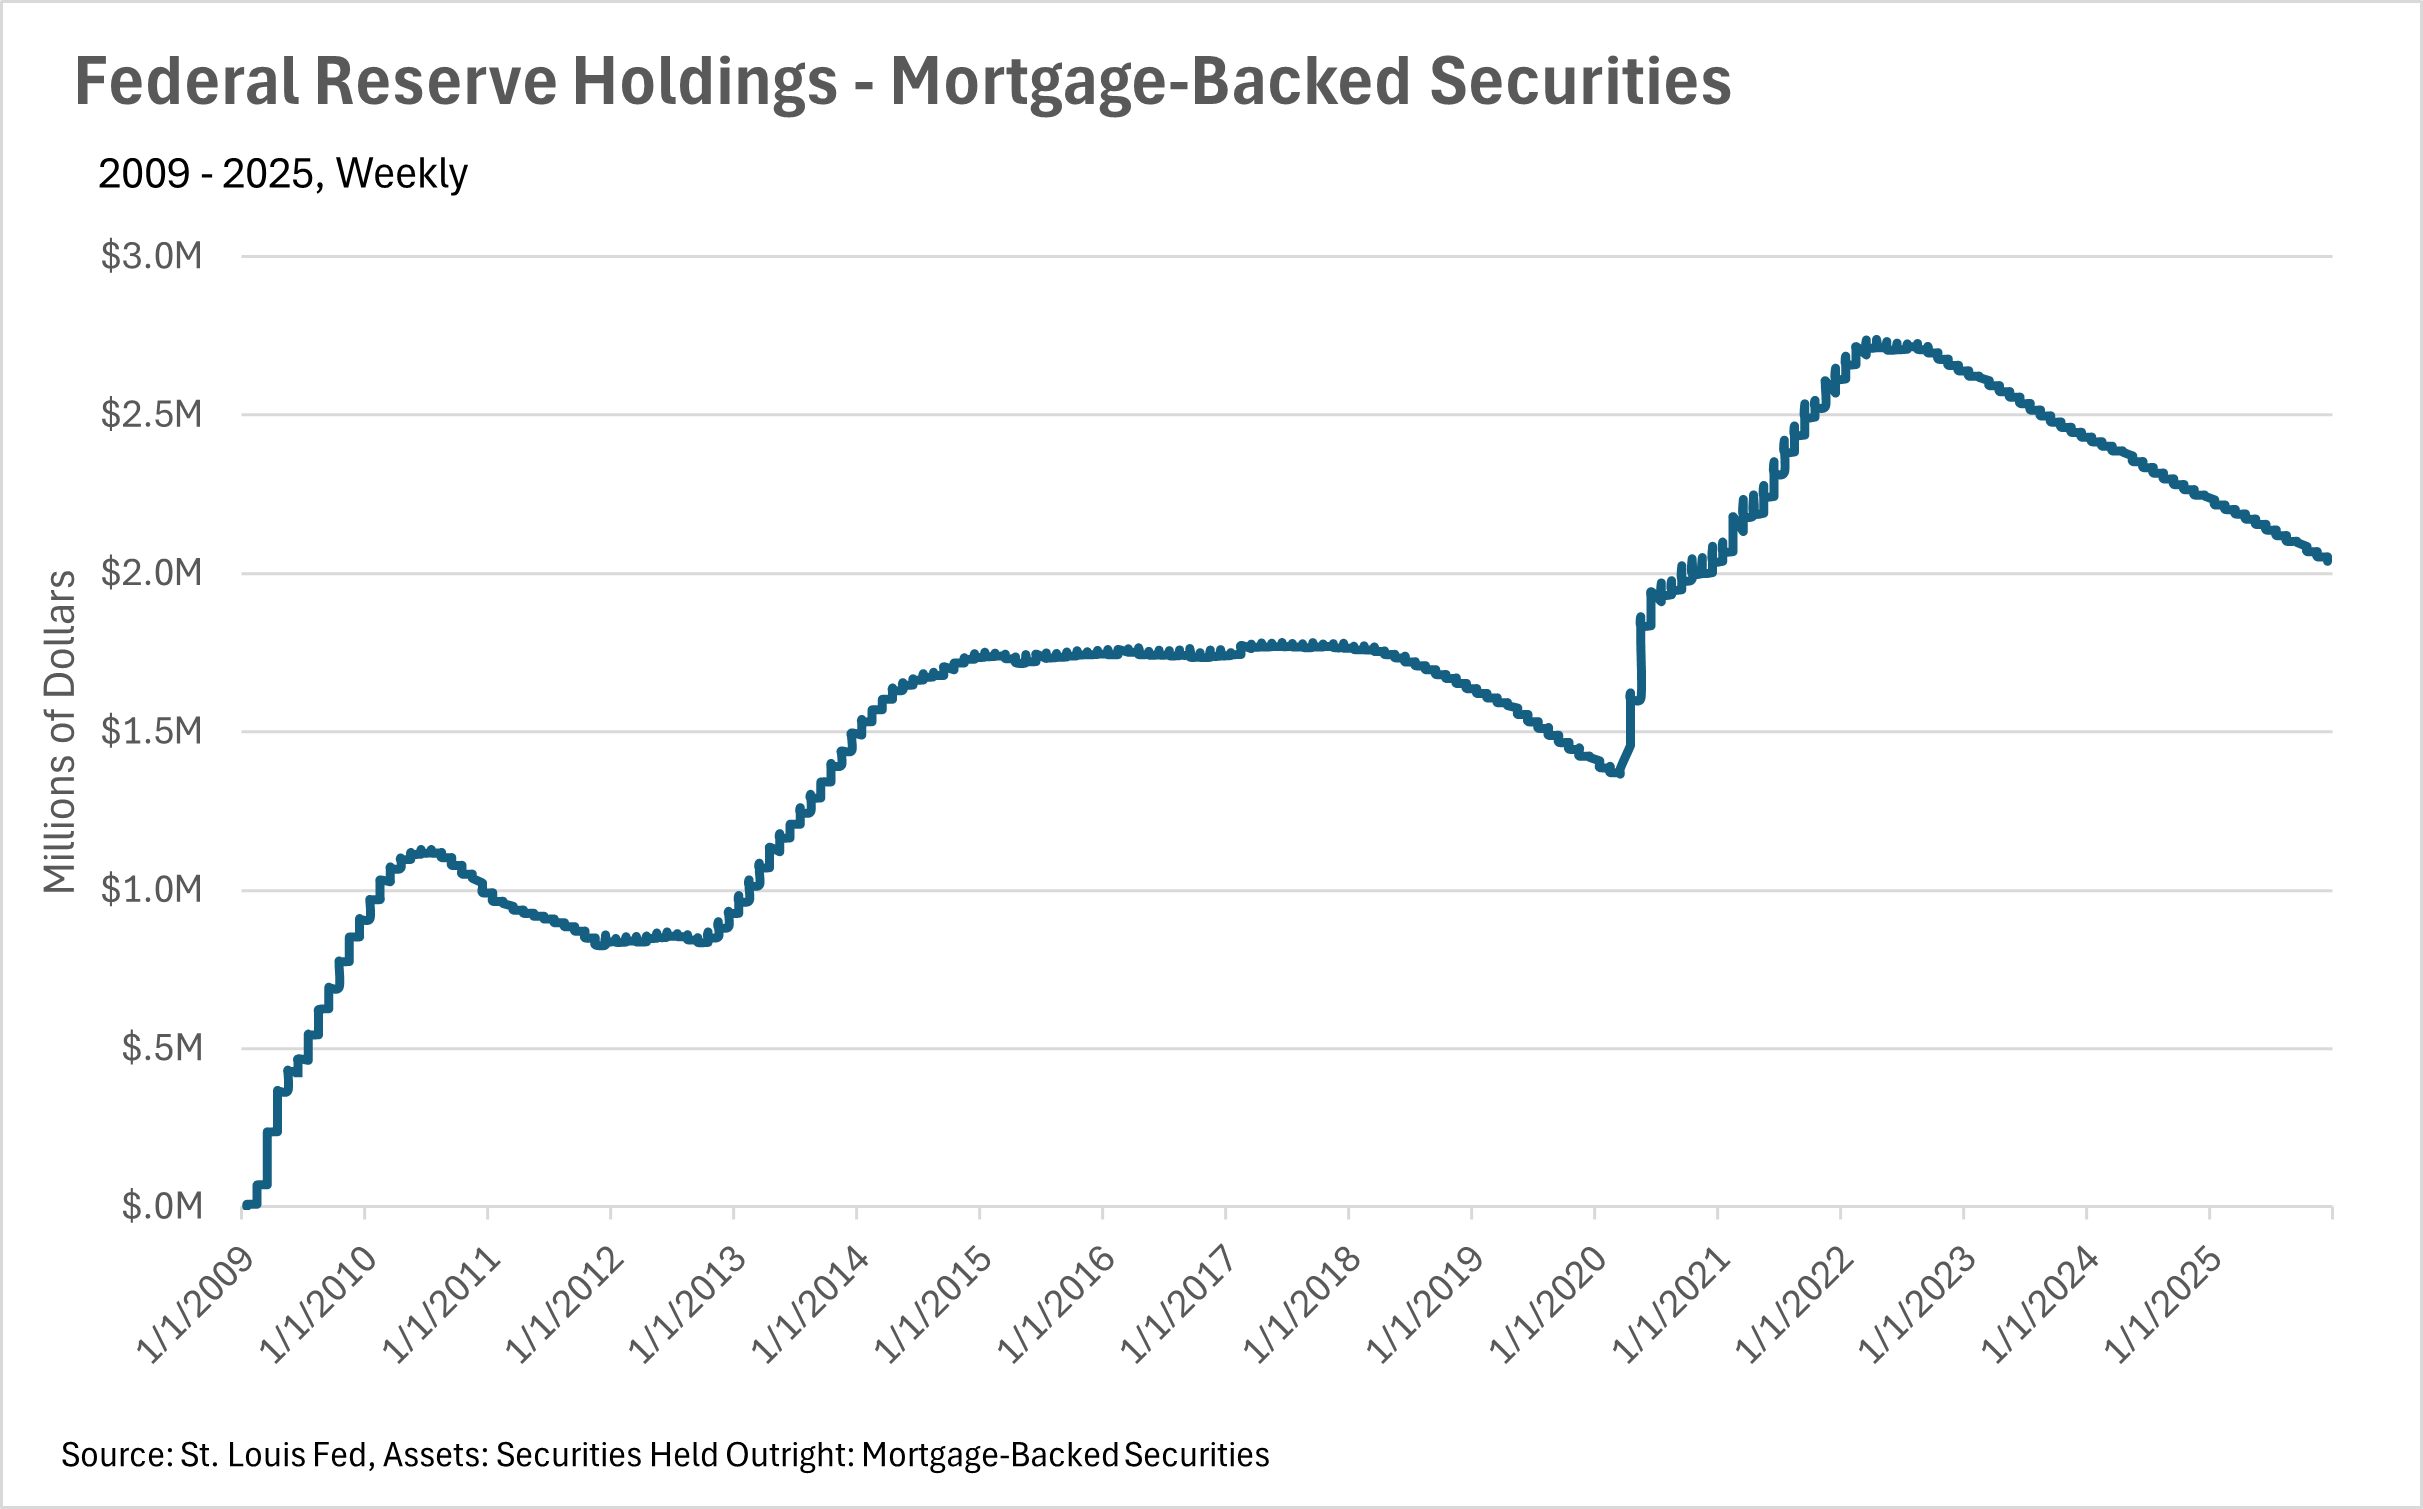
We very briefly saw rates break the 6% mark recently, following some commentary from Trump regarding the purchase of mortgage-backed securities by Fannie and Freddie.
Note: You can find the charts & graphs for the Big Story at the end of the following section.
*National Association of REALTORS® data is released two months behind, so we estimate the most recent month's data when possible and appropriate.
Homeownership is slowly but surely becoming more attainable
With the median monthly P&I payment hitting $2,056 in November, that marks a considerable decrease from the $2,311 maximum that we hit earlier in the year. As you might have guessed, this is largely due to interest rates declining, as the Federal Reserve continues its rate cutting cycle. In November of 2024, interest rates were at 6.79%, compared to 6.22% in November of 2025. This represents an 8.39% decrease in interest rates on a year-over-year basis, while the median sale price of a home in the US actually increased by 1.19% during that same period of time. As interest rates slowly creep down, we will likely see home values continue to increase, as the deciding factor for most people is not the total purchase amount, but instead the monthly payment that they can afford.
Mortgage rates fall to the lowest levels we’ve seen in years
As we mentioned in the prior section, interest rates continue to creep lower and lower. We saw rates hit 6.22% in November, and have fallen even further since then. As of right now, the average interest rate for a 30 year, fixed rate mortgage is sitting around 6.06%, which is actually a slight increase from what we briefly saw last week. Unfortunately, some recent commentary from the Fed has led markets to believe we won’t see a rate cut as a result of the January FOMC meeting, as CME FedWatch puts the probability of a 25 bps cut at just 5% for January. However, it’ll be important to pay attention to the economic data that’s being released over the coming months, as it’ll give us a good idea of where we can expect rates to go in the near term future.
Although mortgage rates are down, inventories are up!
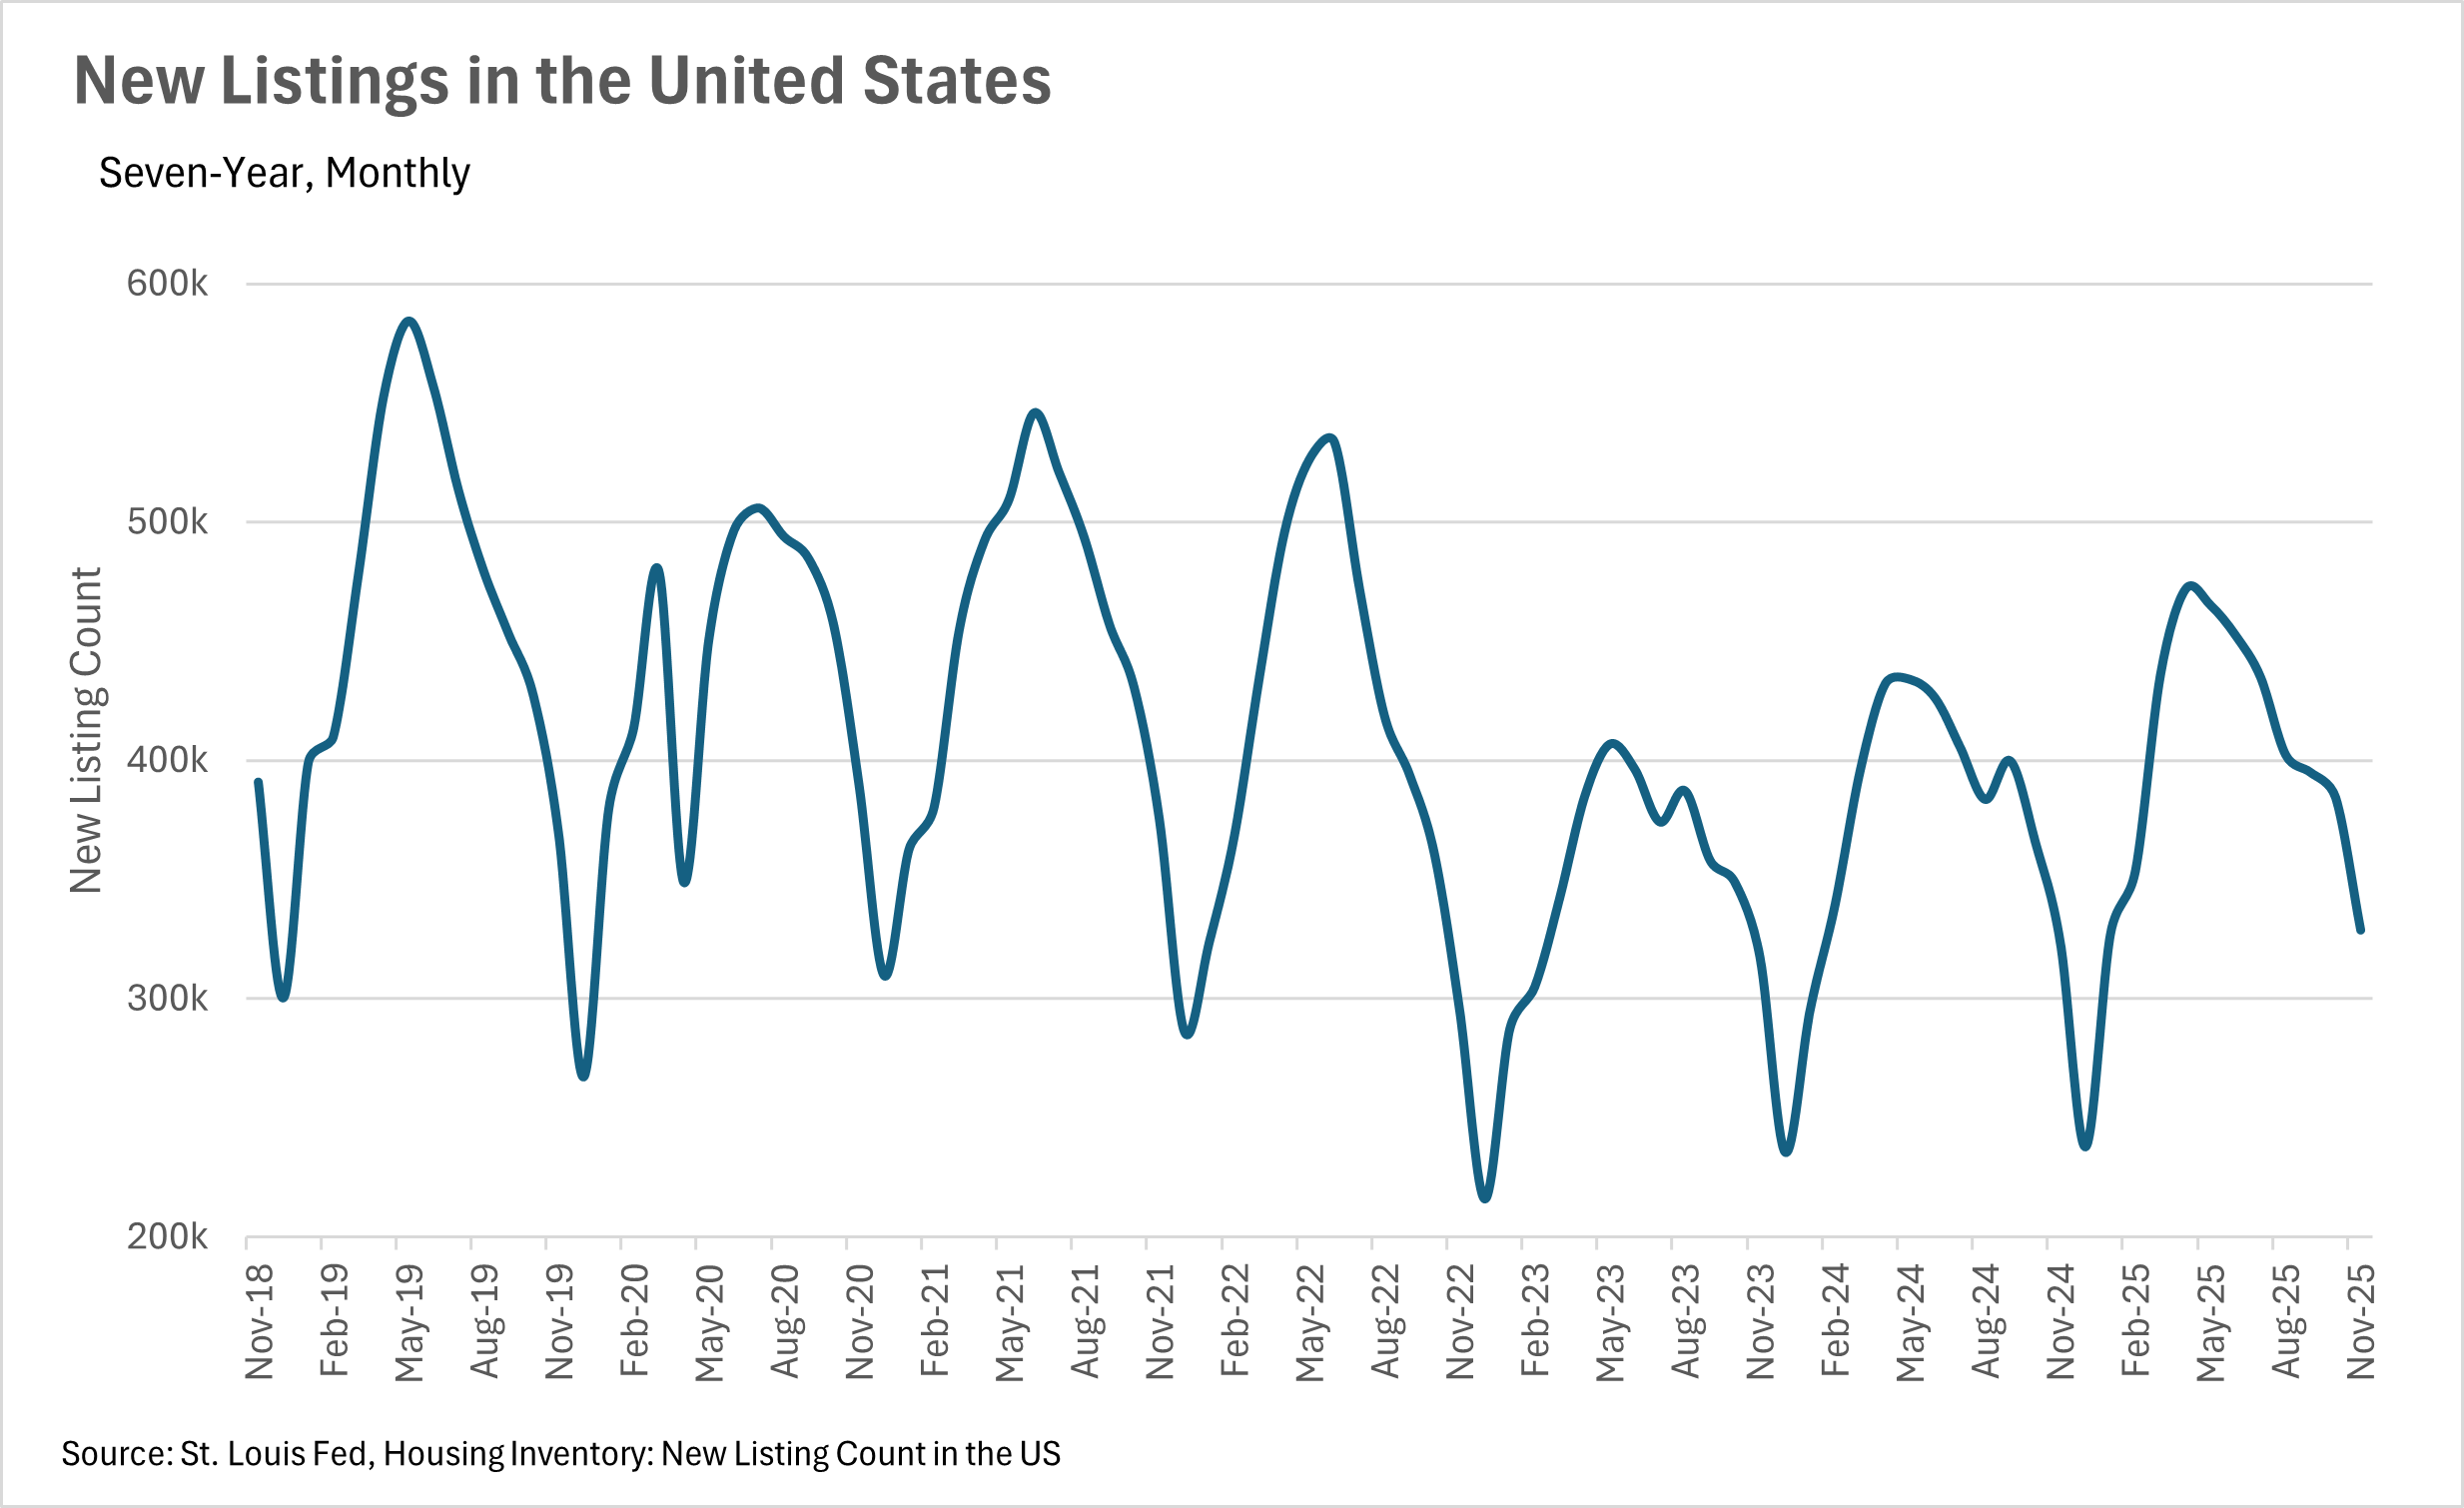
While you might expect inventories to decrease as interest rates decrease, that wasn’t the case in November. In fact, we saw inventories increase by 7.52% on a year-over-year basis, despite falling rates. This is largely attributable to the fact that existing home sales decreased by roughly half a percent while new home listings increased by roughly 1.7% on a year-over-year basis. We’ll likely see inventories continue to increase as we move through the winter months, until the usual spring rush begins and inventories start to move once again. Overally, we had a very different year in terms of market dynamics in 2025, so it’ll be interesting to watch where the market goes in 2026.
Keep an eye on the market as we move through 2026
We’ve gotten to the point where rates have been so high for so long, that there is a considerable cohort of people that’s waiting on the sidelines, carefully watching interest rates. This cohort of people is ready to make a move on their first home, or is looking for a good point in time to sell their existing home and move. Lately we’ve seen quite a bit of commentary out of the Federal Reserve that has markets thinking we’ll see rate cuts, especially when you couple this with the commentary regarding interest rates coming from the executive branch. If we do see some steeper rate cuts (more than the 25 bps cuts we’ve seen recently), then moving quickly will be pivotal for you and your clients, as bigger cuts will likely lead to the floodgates opening!
Of course, this is all what we’re seeing at a national, macro level. As we all know, real estate is a localized game, so be sure to check out your local lowdown below, to see what’s going on in your market!
Big Story Data
The Local Lowdown
Quick Take:
-
Median sale prices maintain modest positive growth with a 1.82% year-over-year increase in November 2025, continuing the recovery from earlier weakness.
-
Inventory levels experience a dramatic year-end plunge with a 22.19% month-over-month decrease in December, while still maintaining a 10.80% year-over-year increase.
-
The median listing is spending 34 days on the market, unchanged from October and representing a 25.93% increase compared to the same time last year.
Note: You can find the charts/graphs for the Local Lowdown at the end of this section.
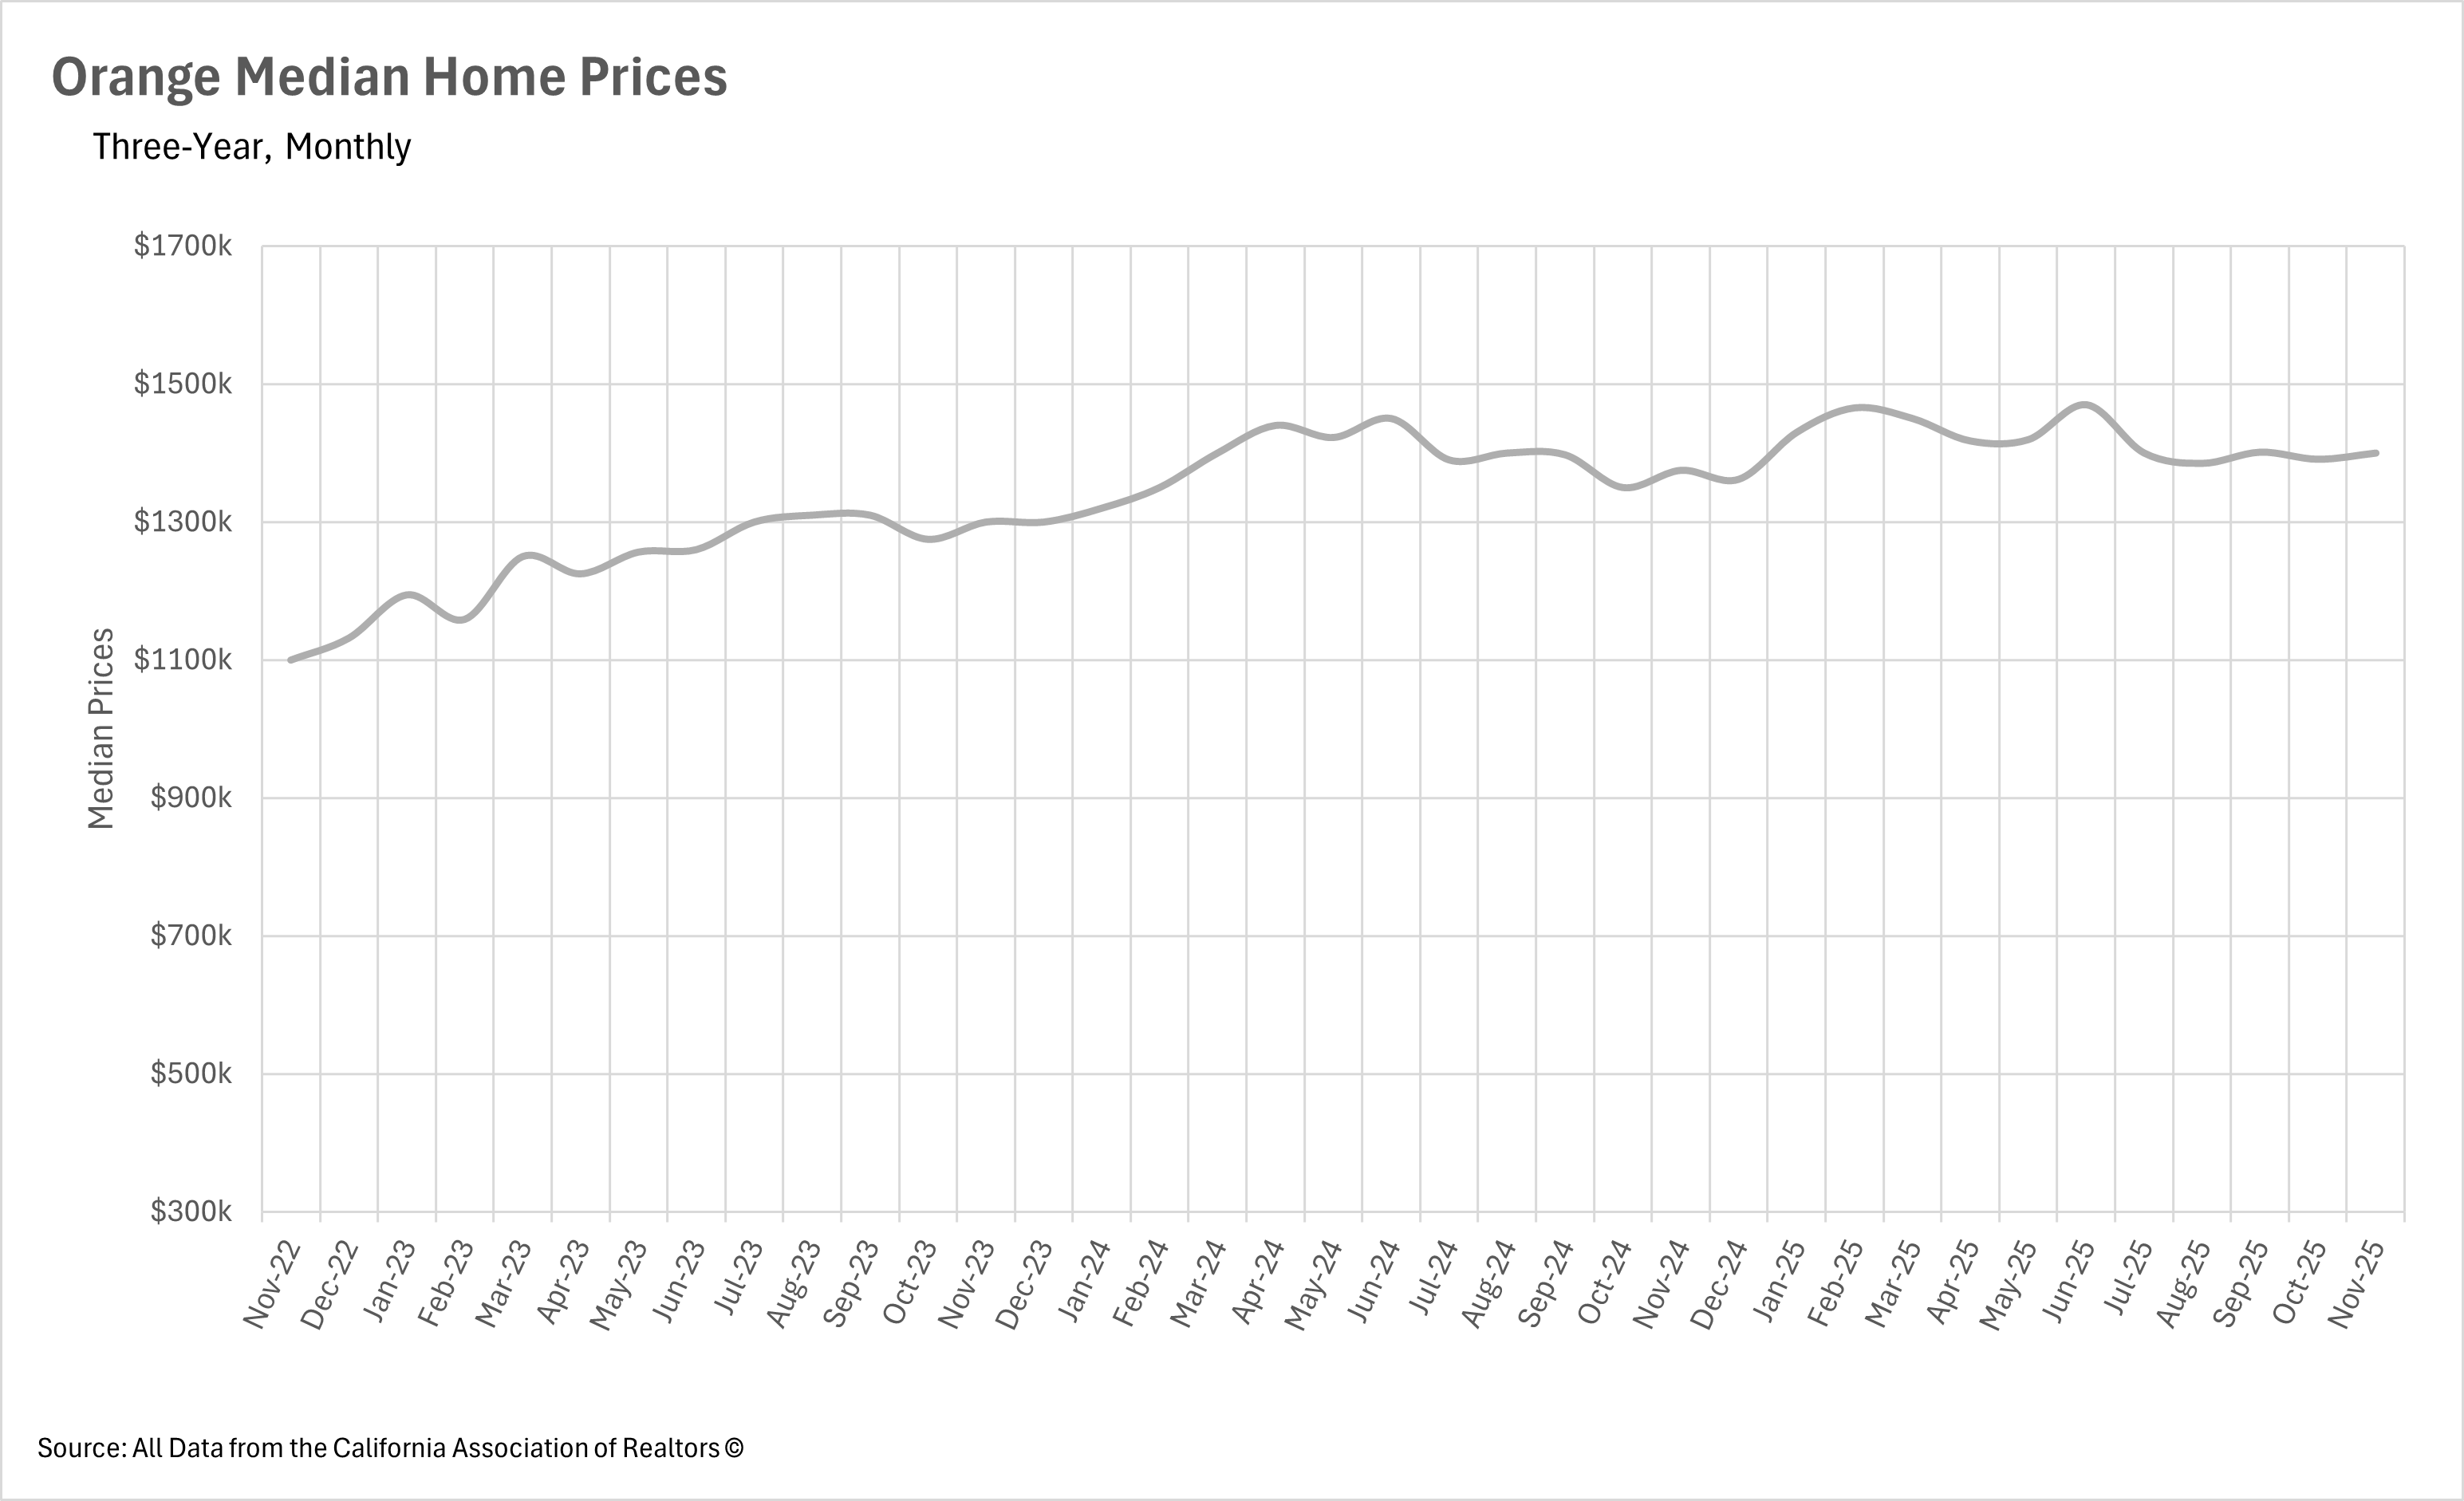
Orange County Prices Show Steady but Modest Growth
Orange County's housing market continues to demonstrate stable, modest appreciation as we close out the year. November 2025 saw the median single-family home selling for $1,400,000, representing a 1.82% increase compared to November 2024's $1,375,000. This positive growth, while more subdued than the 3.04% year-over-year increase seen in October, still represents a healthy continuation of the recovery from the negative growth experienced earlier in the year. The median price also showed modest month-over-month growth of 0.65% from October's $1,391,000, suggesting that pricing has stabilized in a relatively narrow band. This steady appreciation pattern indicates the market has reached an equilibrium where buyer demand and seller expectations align, creating sustainable price growth without the volatility seen in earlier months of 2025.
Inventory Experiences Dramatic Year-End Collapse
Orange County's housing inventory has experienced an unprecedented year-end decline as we enter the traditionally slow holiday season. The latest data for December 2025 shows just 3,027 single-family homes on the market, representing a dramatic 22.19% month-over-month plunge from November's 3,890 homes. This marks the fifth consecutive month of declining inventory levels, with December's drop representing by far the steepest decline of the fall season. Despite this dramatic retreat, the market still maintains a 10.80% year-over-year increase compared to December 2024's 2,732 homes, meaning buyers have marginally more options than they did last year. However, the magnitude of the recent decline demonstrates just how quickly market dynamics can shift during the holiday season, as sellers pull listings off the market and new inventory dries up almost entirely. This inventory collapse has brought levels much closer to the tight conditions of late 2024.
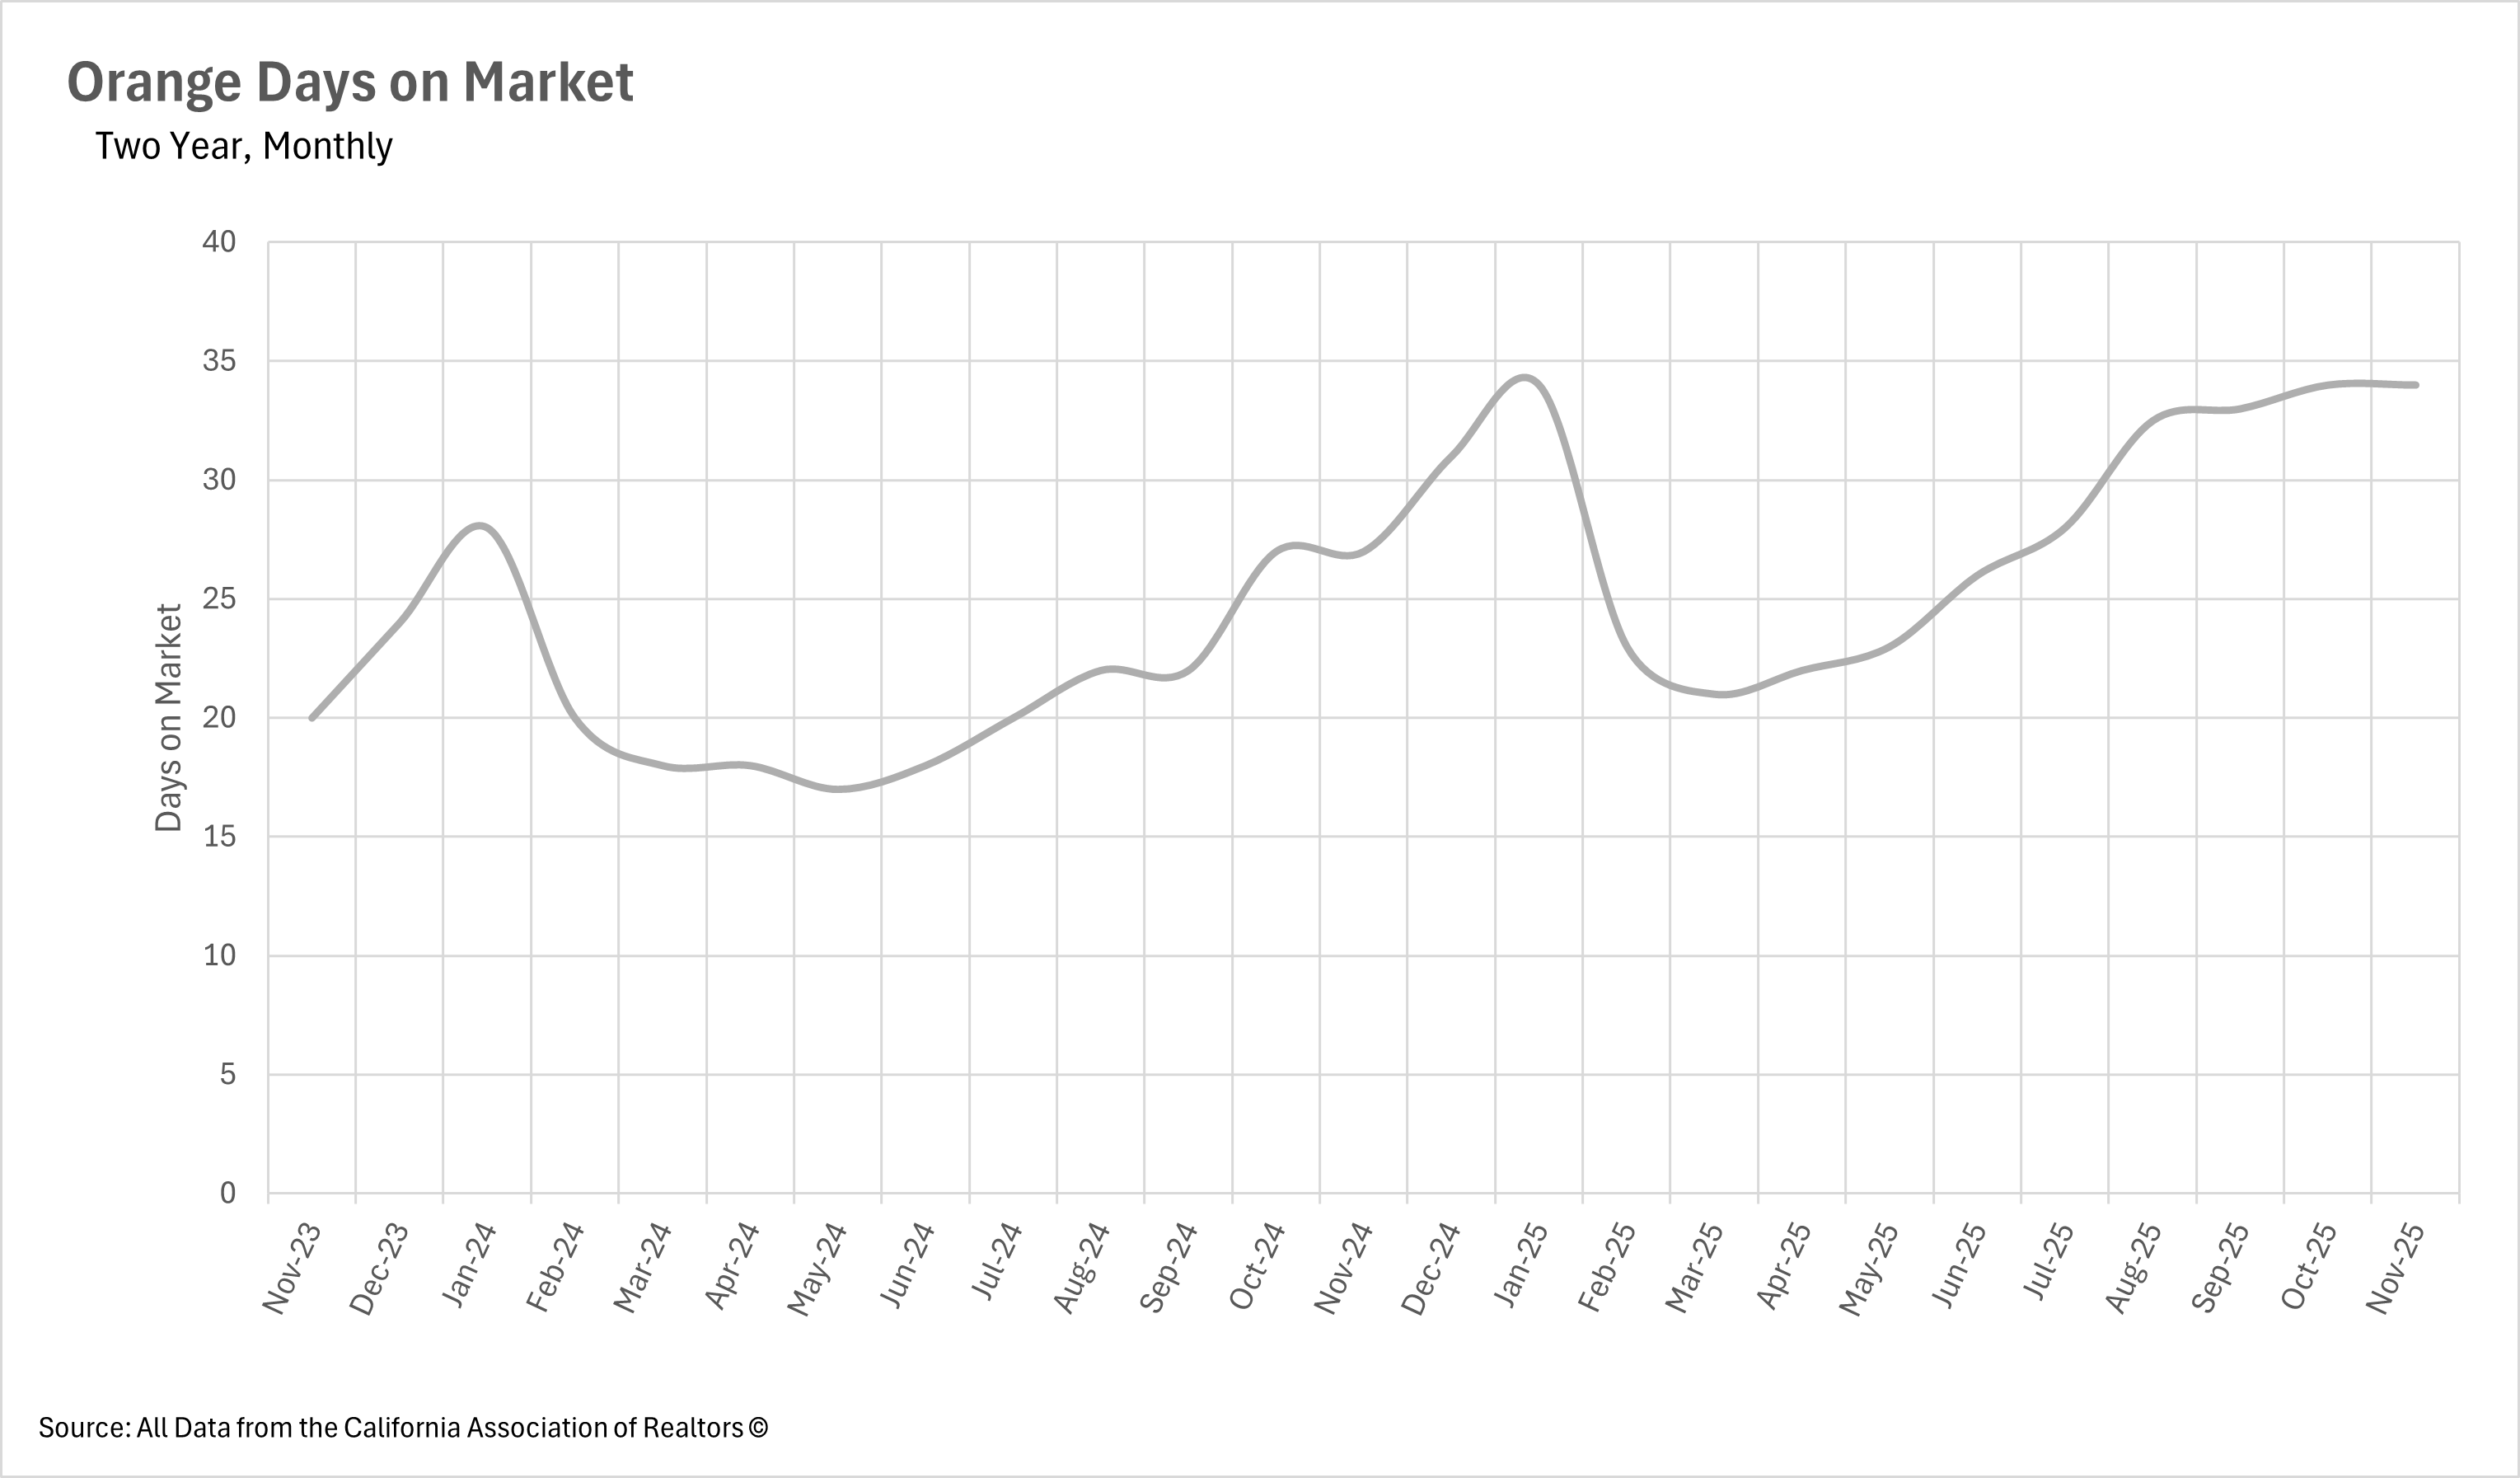
Market Pace Plateaus at Elevated Levels Despite Inventory Decline
Despite the dramatic decline in inventory, selling times have plateaued at their elevated levels rather than accelerating. The median single-family home in Orange County continues to sit on the market for 34 days before selling, completely unchanged from October and representing a substantial 25.93% increase from November 2024's 27 days. This 0% month-over-month change is particularly noteworthy given the sharp decline in available inventory, which would typically be expected to speed up transactions. The fact that selling times remain elevated even as inventory drops sharply suggests that buyer caution remains deeply entrenched in the market psychology. While sellers may have regained some leverage through reduced competition, buyers are still taking their time with purchase decisions, maintaining the deliberate, methodical approach that has characterized the market throughout 2025.
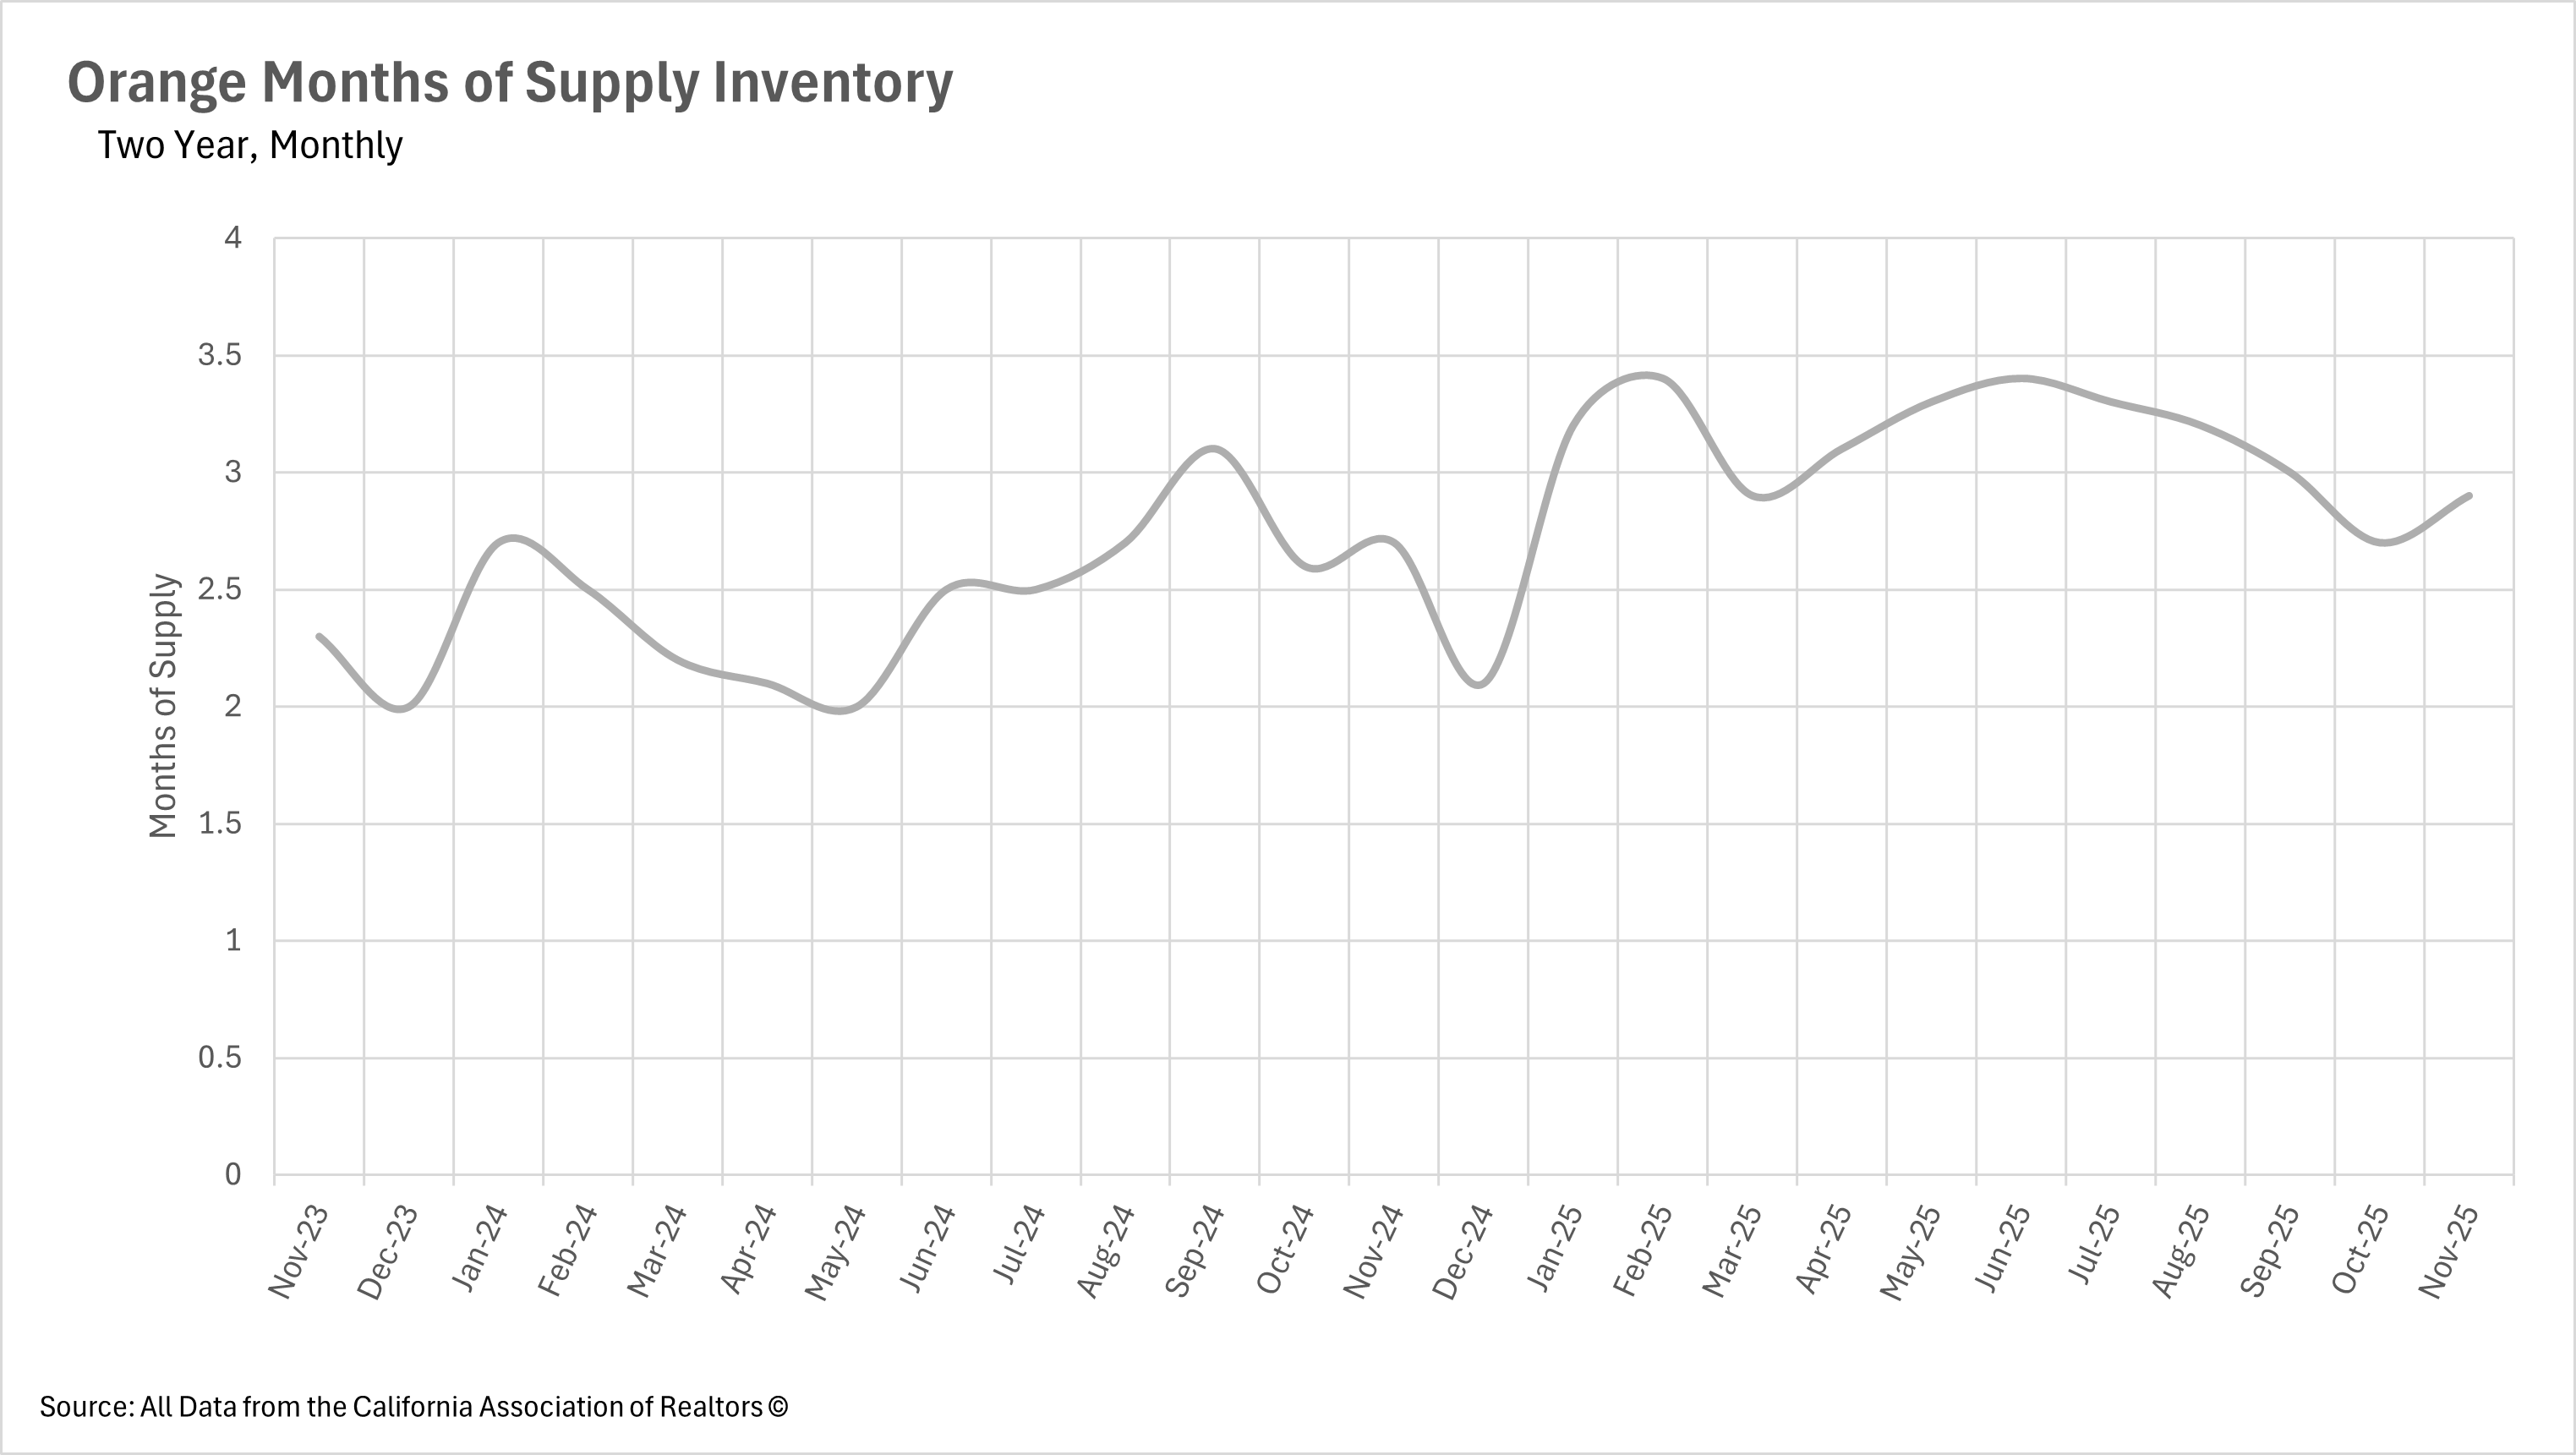
Orange County Hovers at the Edge of Balanced Market Territory
When determining whether a market is a buyers’ market or a sellers’ market, we look to the Months of Supply Inventory (MSI) metric. The state of California has historically averaged around three months of MSI, so any area with at or around three months of MSI is considered a balanced market. Any market that has lower than three months of MSI is considered a sellers’ market, whereas markets with more than three months of MSI are considered buyers’ markets.
With 2.9 months of supply inventory in November 2025, Orange County sits right at the edge of balanced market territory, essentially representing market equilibrium. This represents a notable 7.41% month-over-month increase from October's 2.7 months and a matching 7.41% year-over-year increase from November 2024's 2.7 months of supply. This slight uptick in MSI despite the sharp inventory decline reflects the seasonal slowdown in sales activity that typically occurs during the holiday period. The market's position at essentially three months of supply creates a truly neutral environment where neither buyers nor sellers have significant leverage. As we move into 2026, the direction of this metric will be critical in determining whether the market tilts back toward seller favorability or maintains this balanced state.