
The Big Story
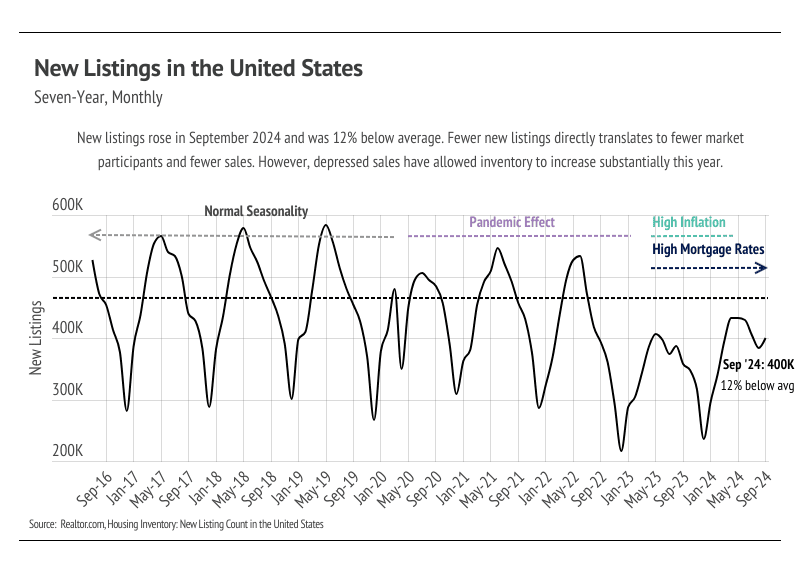
Sellers are coming back to the market
Quick Take:
-
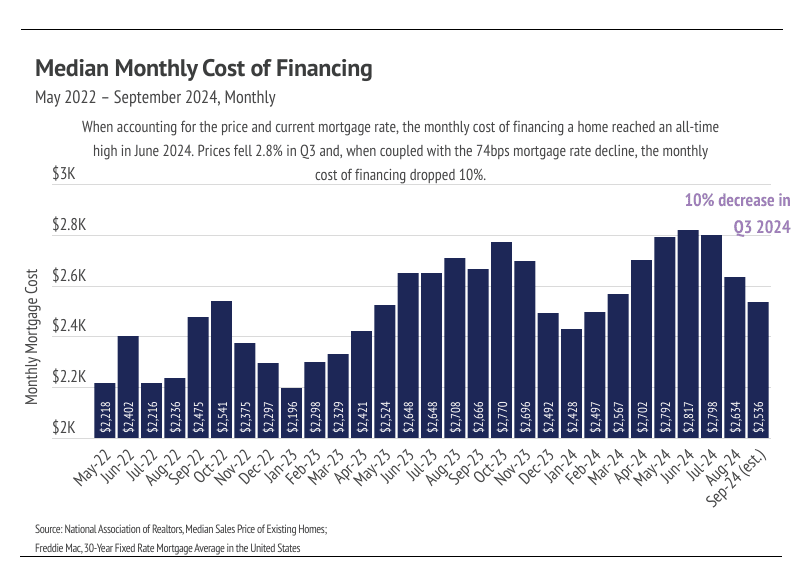
Affordability improved dramatically in Q3 2024 with the monthly mortgage payment for a 30-year loan down 10%. Prices are contracting slightly, which is the seasonal norm.
-
In September, the average 30-year mortgage rate declined for the third month to 6.08%, a 1.14% drop from the 2024 high reached in early May. The Fed also cut rates in September and will likely continue cutting them over the next six months.
-
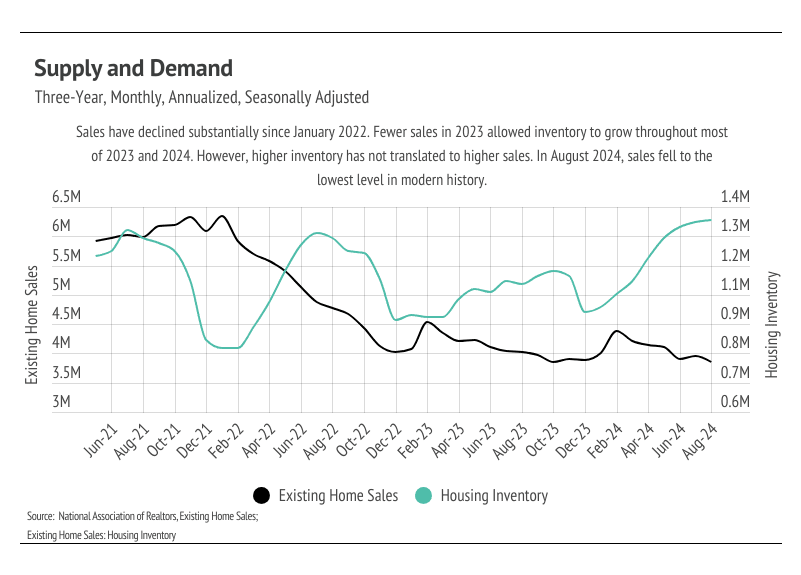
Sales declined 2.5% month over month, falling to the lowest level in modern history, while inventory rose to its highest level since 2020. Better affordability hasn’t yet translated to higher sales.
Note: You can find the charts & graphs for the Big Story at the end of the following section.
*National Association of REALTORS® data is released two months behind, so we estimate the most recent month’s data when possible and appropriate.
More inventory hasn’t translated to sales…yet
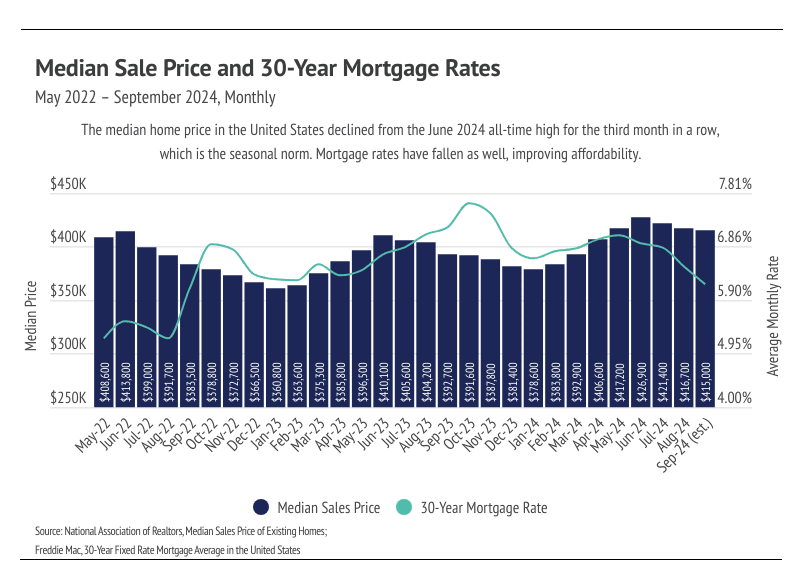
Enough data has been released to suggest that home prices peaked nationally in June 2024, and won’t peak again this year. Of course, there will be deviations in local markets, but the larger trend is clear: home prices are returning to a more normal growth and contraction cycle in which prices increase from January to June and contract from June to January. Sales have trended lower for nearly three years now, and that sales slowdown has allowed inventory to build to the highest level since 2020.
We were hopeful that sales would continue to increase this month due to the declining rates as it did last month, but sales fell to the lowest level in modern history. Even though the Fed lowered their benchmark rate by 0.50% at the September Fed meeting, mortgage rates weren’t largely affected, mainly because the rate cut was already priced into the current mortgage rates. In Q3 2024, the median price fell 2.8% and the mortgage rate declined by 74 bps, causing the payment on a monthly 30-year mortgage to drop 10%. Affordability is improving and the median home buyer saved $100,000 over the life of the loan, if they bought in September rather than June (a huge change in just three months!). Rate cuts and improved affordability are a promising sign as we look ahead to the spring market. We expect to enter 2025 with falling rates, high inventory, and seasonally lower home prices, which should create the perfect storm necessary for a hot spring market.


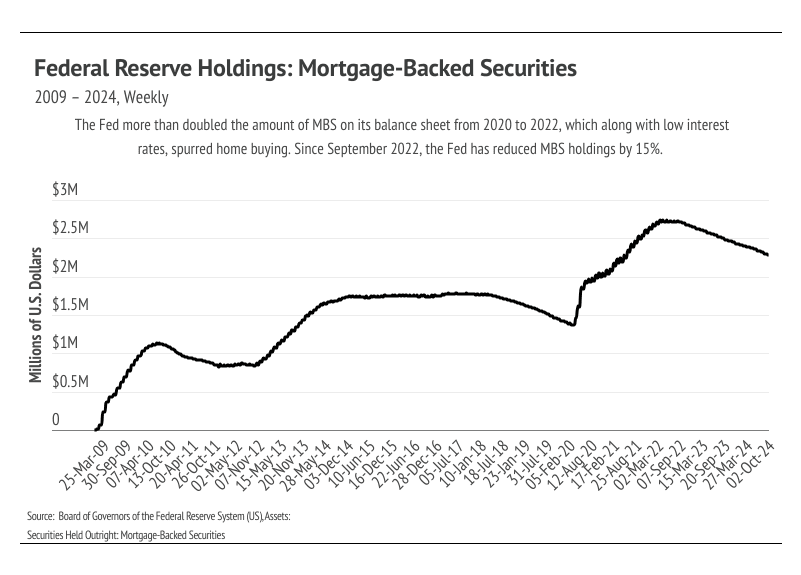
During the early pandemic, the Fed provided huge incentives to buy homes as part of its easy monetary policy by purchasing Mortgage-Backed Securities (MBS) and dropping interest rates. MBS play an integral role in home financing by allowing banks to bundle and sell mortgage loans, turning the bank into an intermediary between the financier and financial markets (investors). Banks get some fees, while investors (rather than the bank) get the interest and incur the risk from the bundle of mortgages. So, in many ways, the bank facilitates the loan but investors are the ones really lending the buyer the money. The Fed was a huge investor in 2020 and 2021, doubling its MBS holdings to $2.7 trillion by 2022. However, the Fed isn’t buying any more MBS and, in fact, has sold 15% ($4.16B) of its MBS holdings over the past two years. Even though rates are coming down, the MBS market has shifted to make loans less easy to originate, which has contributed to the market slowdown.
Last September, the average 30-year mortgage rate was 7.31%, meaning that a $500,000 loan would cost $3,431 per month. For reference, that same loan now costs $3,056 per month at 6.08%. Because the interest rate has such an outsized impact on the affordability of a home, fewer buyers entered the market, allowing inventory to build. Even though far fewer sales occurred over the past year, prices still rose, which they almost always do. This is actually a newer phenomenon, but one that isn’t going away. Since the mid-1990s, home prices began to move more like risk assets (stocks, bonds, commodities, etc.), which marked a huge change from the preceding 100 years. From 1890 to 1990, inflation-adjusted home prices rose only 12%, which is hard to imagine with the massive price growth, up 94% nationally, that we’ve seen over the past 10 years. All that to say, home prices over time really only move in one direction, which is up.
Different regions and individual houses vary from the broad national trends, so we’ve included a Local Lowdown below to provide you with in-depth coverage for your area. As always, we will continue to monitor the housing and economic markets to best guide you in buying or selling your home.
Big Story Data
The Local Lowdown
Quick Take:
-
The median single-family home price rose in August, likely due to falling mortgage rates, but declined slightly in September. We expect price contractions in Q4, which is the seasonal norm.
-
Inventory has doubled since the beginning of 2024. More homes on the market only benefits Orange County, which has been extremely undersupplied for the past four years.
-
Months of Supply Inventory remained below three months of supply in September, indicating the market still favors sellers. Homes are still selling quickly, but Days on Market is moving slightly higher.
Note: You can find the charts/graphs for the Local Lowdown at the end of this section.
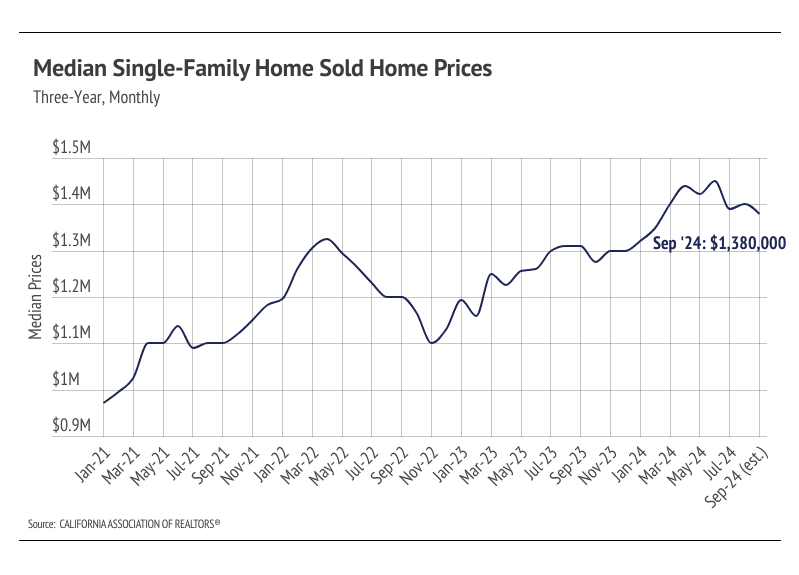
The median single-family home price fell but is still near all-time highs
In Orange County, single-family home prices hit a record high in June 2024, reaching $1.45 million. High demand relative to the low, but growing, inventory has kept prices moving higher even during a time of elevated mortgage rates. High mortgage rates have really only slowed the market rather than decreasing the sticker price of homes. Prices in Southern California generally haven’t experienced larger drops due to higher mortgage rates. September saw the 15th consecutive month of year-over-year price growth for single-family homes. Prices typically peak in the summer months, and we don’t expect new all-time highs this year. However, we do expect some minor price contraction in Q4, similar to the modest price decline in Q3.
High mortgage rates soften both supply and demand, but home buyers and sellers seemed to tolerate rates near 6% much more than around 7%. Now that rates are declining, sales could get a little boost, but the housing market typically slows in the fourth quarter of any year.
Inventory increased for single-family homes and condos for the eighth month in a row
Total inventory in Orange County fell 85% from July 2019 to January 2022 before building again as mortgage rates rose, pricing potential buyers out of the market. Low inventory and new listings, coupled with high mortgage rates, have led to a substantial drop in sales and a generally slower housing market. Typically, inventory begins to increase in January or February, peaking in July or August before declining once again from the summer months to the winter. In 2023, inventory patterns didn’t resemble the typical seasonal inventory peaks and valleys.
It’s looking like 2024 inventory, sales, and new listings will resemble historically seasonal patterns, but at a depressed level. Even though inventory has doubled from January 2024 to September 2024, it’s still 47% below pre-pandemic levels. Inventory still increased, though, which is atypical in September. Falling mortgage rates have brought buyers and sellers back to the market during the time of year the market tends to slow significantly.
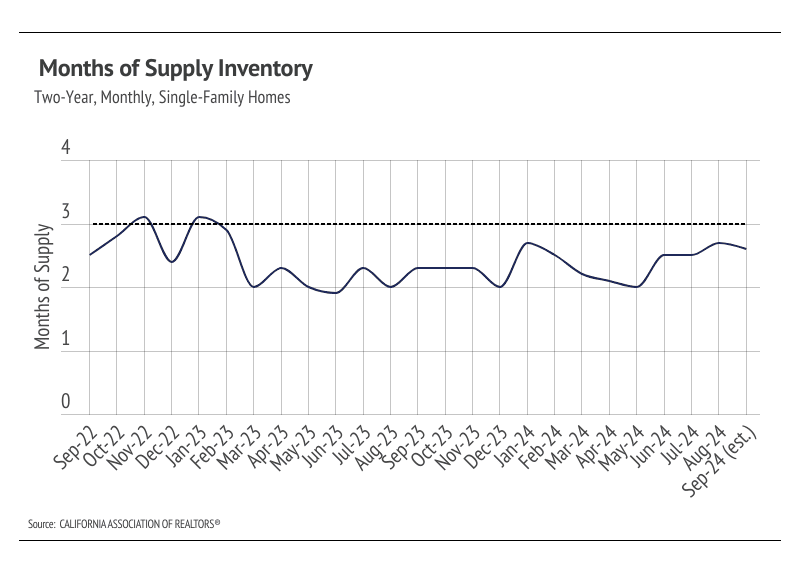
Months of Supply Inventory fell slightly in September 2024 and continued to indicate a sellers’ market
Months of Supply Inventory (MSI) quantifies the supply/demand relationship by measuring how many months it would take for all current homes listed on the market to sell at the current rate of sales. The long-term average MSI is around three months in California, which indicates a balanced market. An MSI lower than three indicates that there are more buyers than sellers on the market (meaning it’s a sellers’ market), while a higher MSI indicates there are more sellers than buyers (meaning it’s a buyers’ market). MSI has been below three months since February 2023. This year, MSI has averaged 2.4 months of supply, and in September, it hit 2.6 months. We expect MSI to remain under three months of supply for the rest of the year. However, it may drift upward in the winter months.
Local Lowdown Data