The Big Story
Quick Take:
-
Mortgage rates continue to slowly move downwards, as the Federal Reserve continues its rate cuts.
-
Inventories remain high, as new supply is hitting the market faster than existing homes are being sold.
-
Last Wednesday, the Fed lowered the federal funds rate by another 25 basis points, bringing the target range to 3.50%-3.75%.
Note: You can find the charts & graphs for the Big Story at the end of the following section.
*National Association of REALTORS® data is released two months behind, so we estimate the most recent month's data when possible and appropriate.
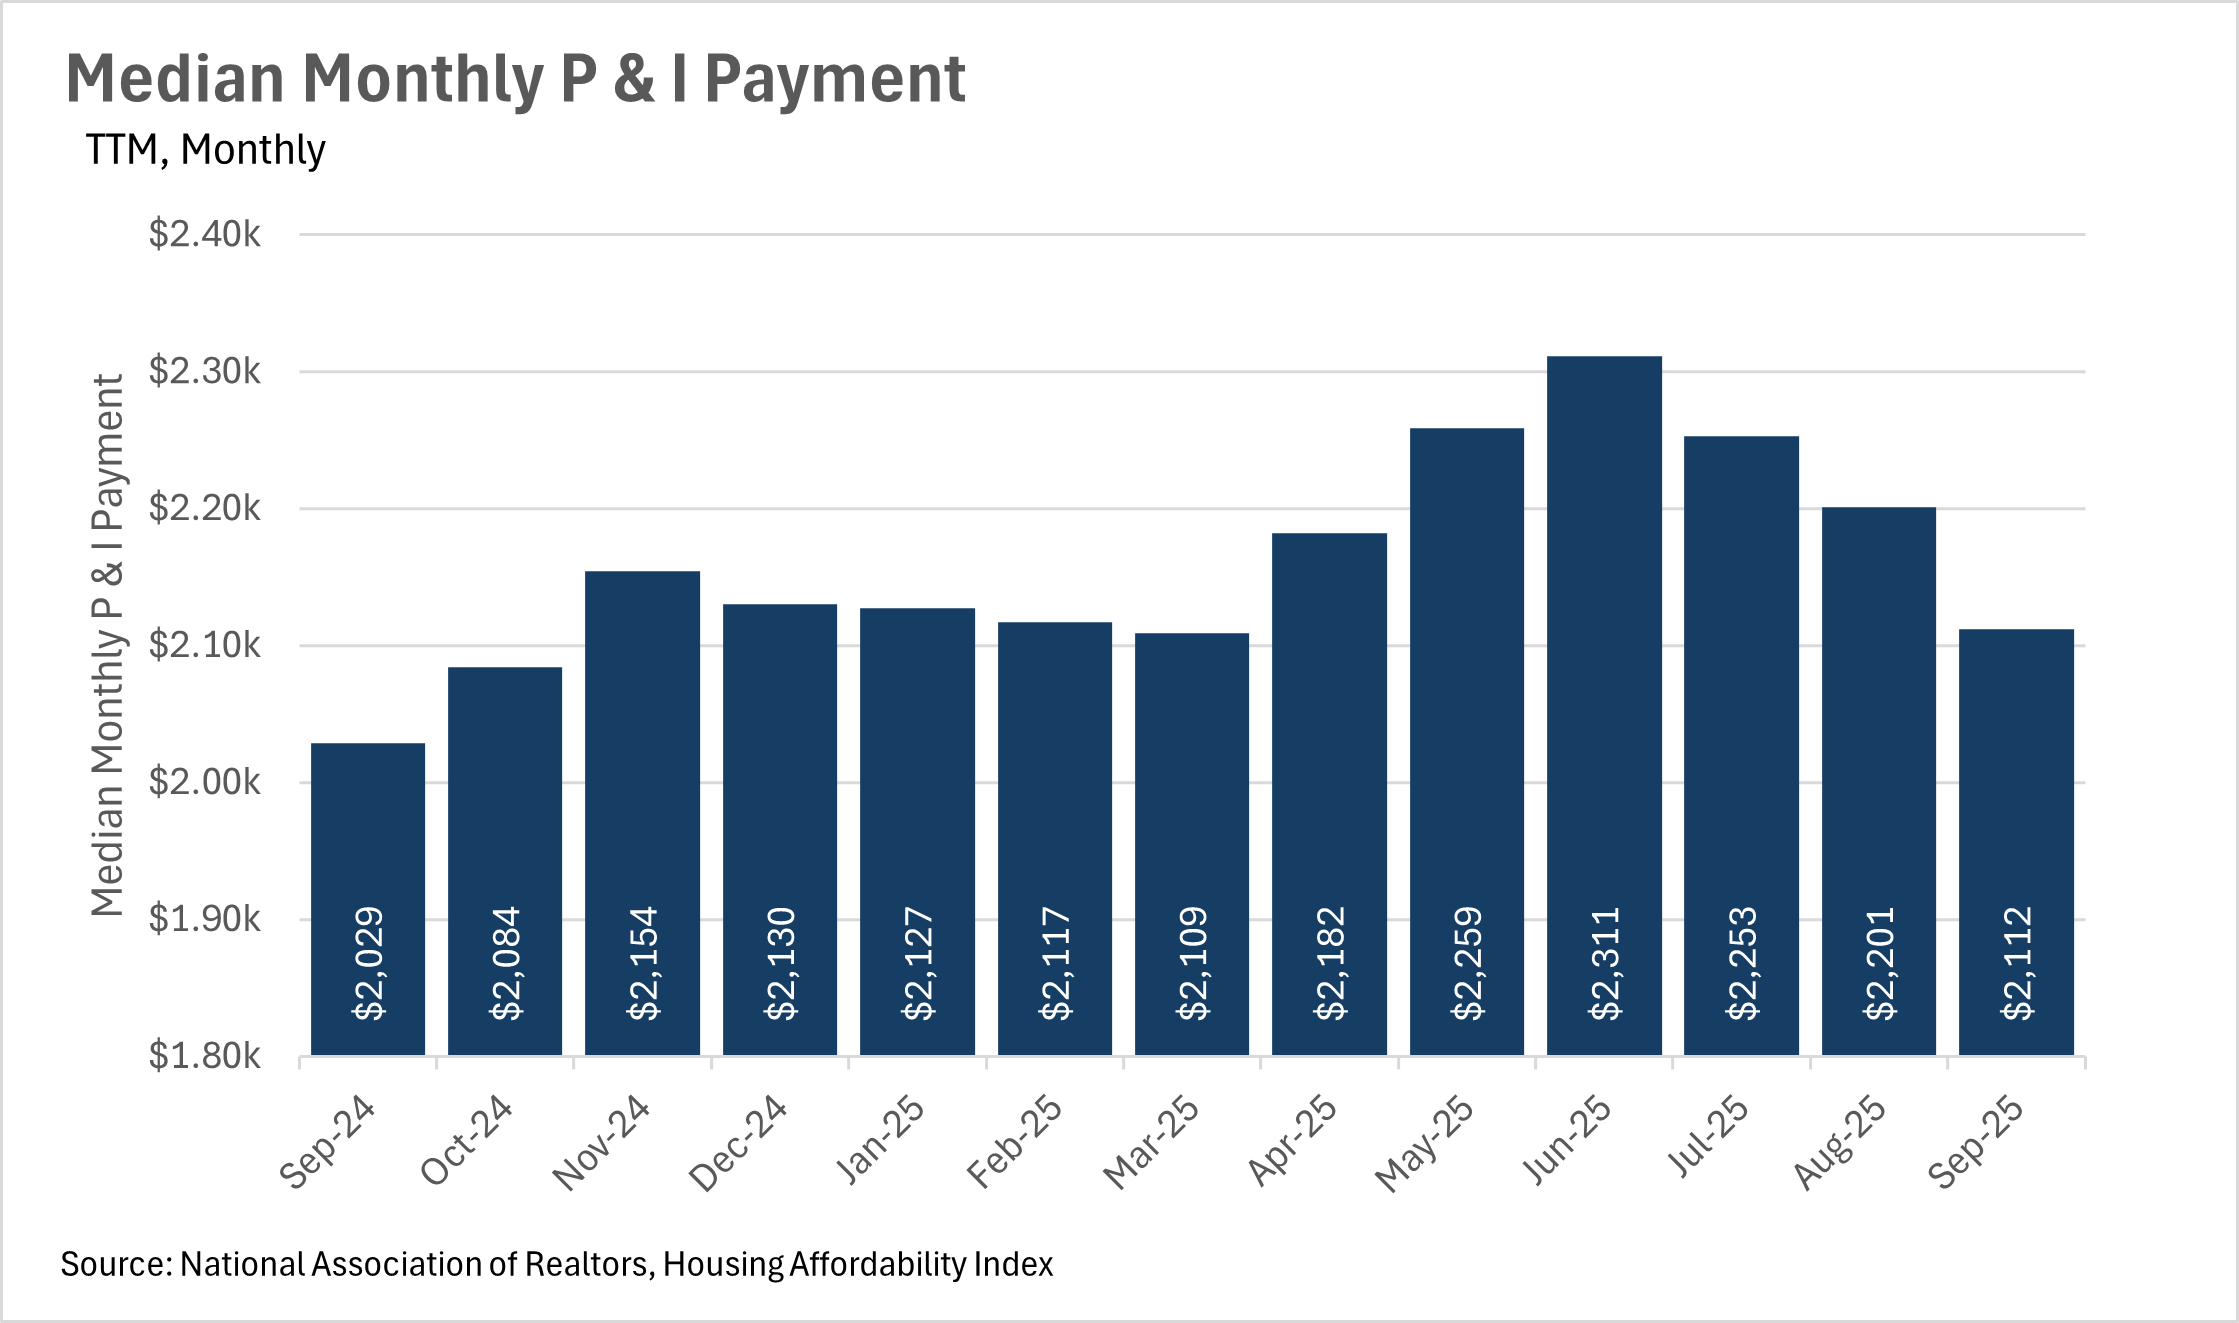
Although they are on the decline, interest rates remain much higher than the inflation rate
Unfortunately, we have yet to see mortgage rates drop below the 6% mark, as the Federal Reserve continues its cutting cycle, after its third consecutive cut to the federal funds rate in December. Although many are hopeful that we will continue to see rate cuts into 2026, the future of the federal funds rate is relatively uncertain. While there’s still roughly a month and a half before the next interest rate decision, CME’s FedWatch tool is predicting roughly a 25% chance that we see another rate cut in January. As we all know, the federal funds rate is the most important factor in the determination of interest rates, so paying attention to what the Fed is doing is pivotal! We’ll likely see an increase in the probability of another rate cut if some of the new/delayed economic data that’s coming out provides a cause for concern.
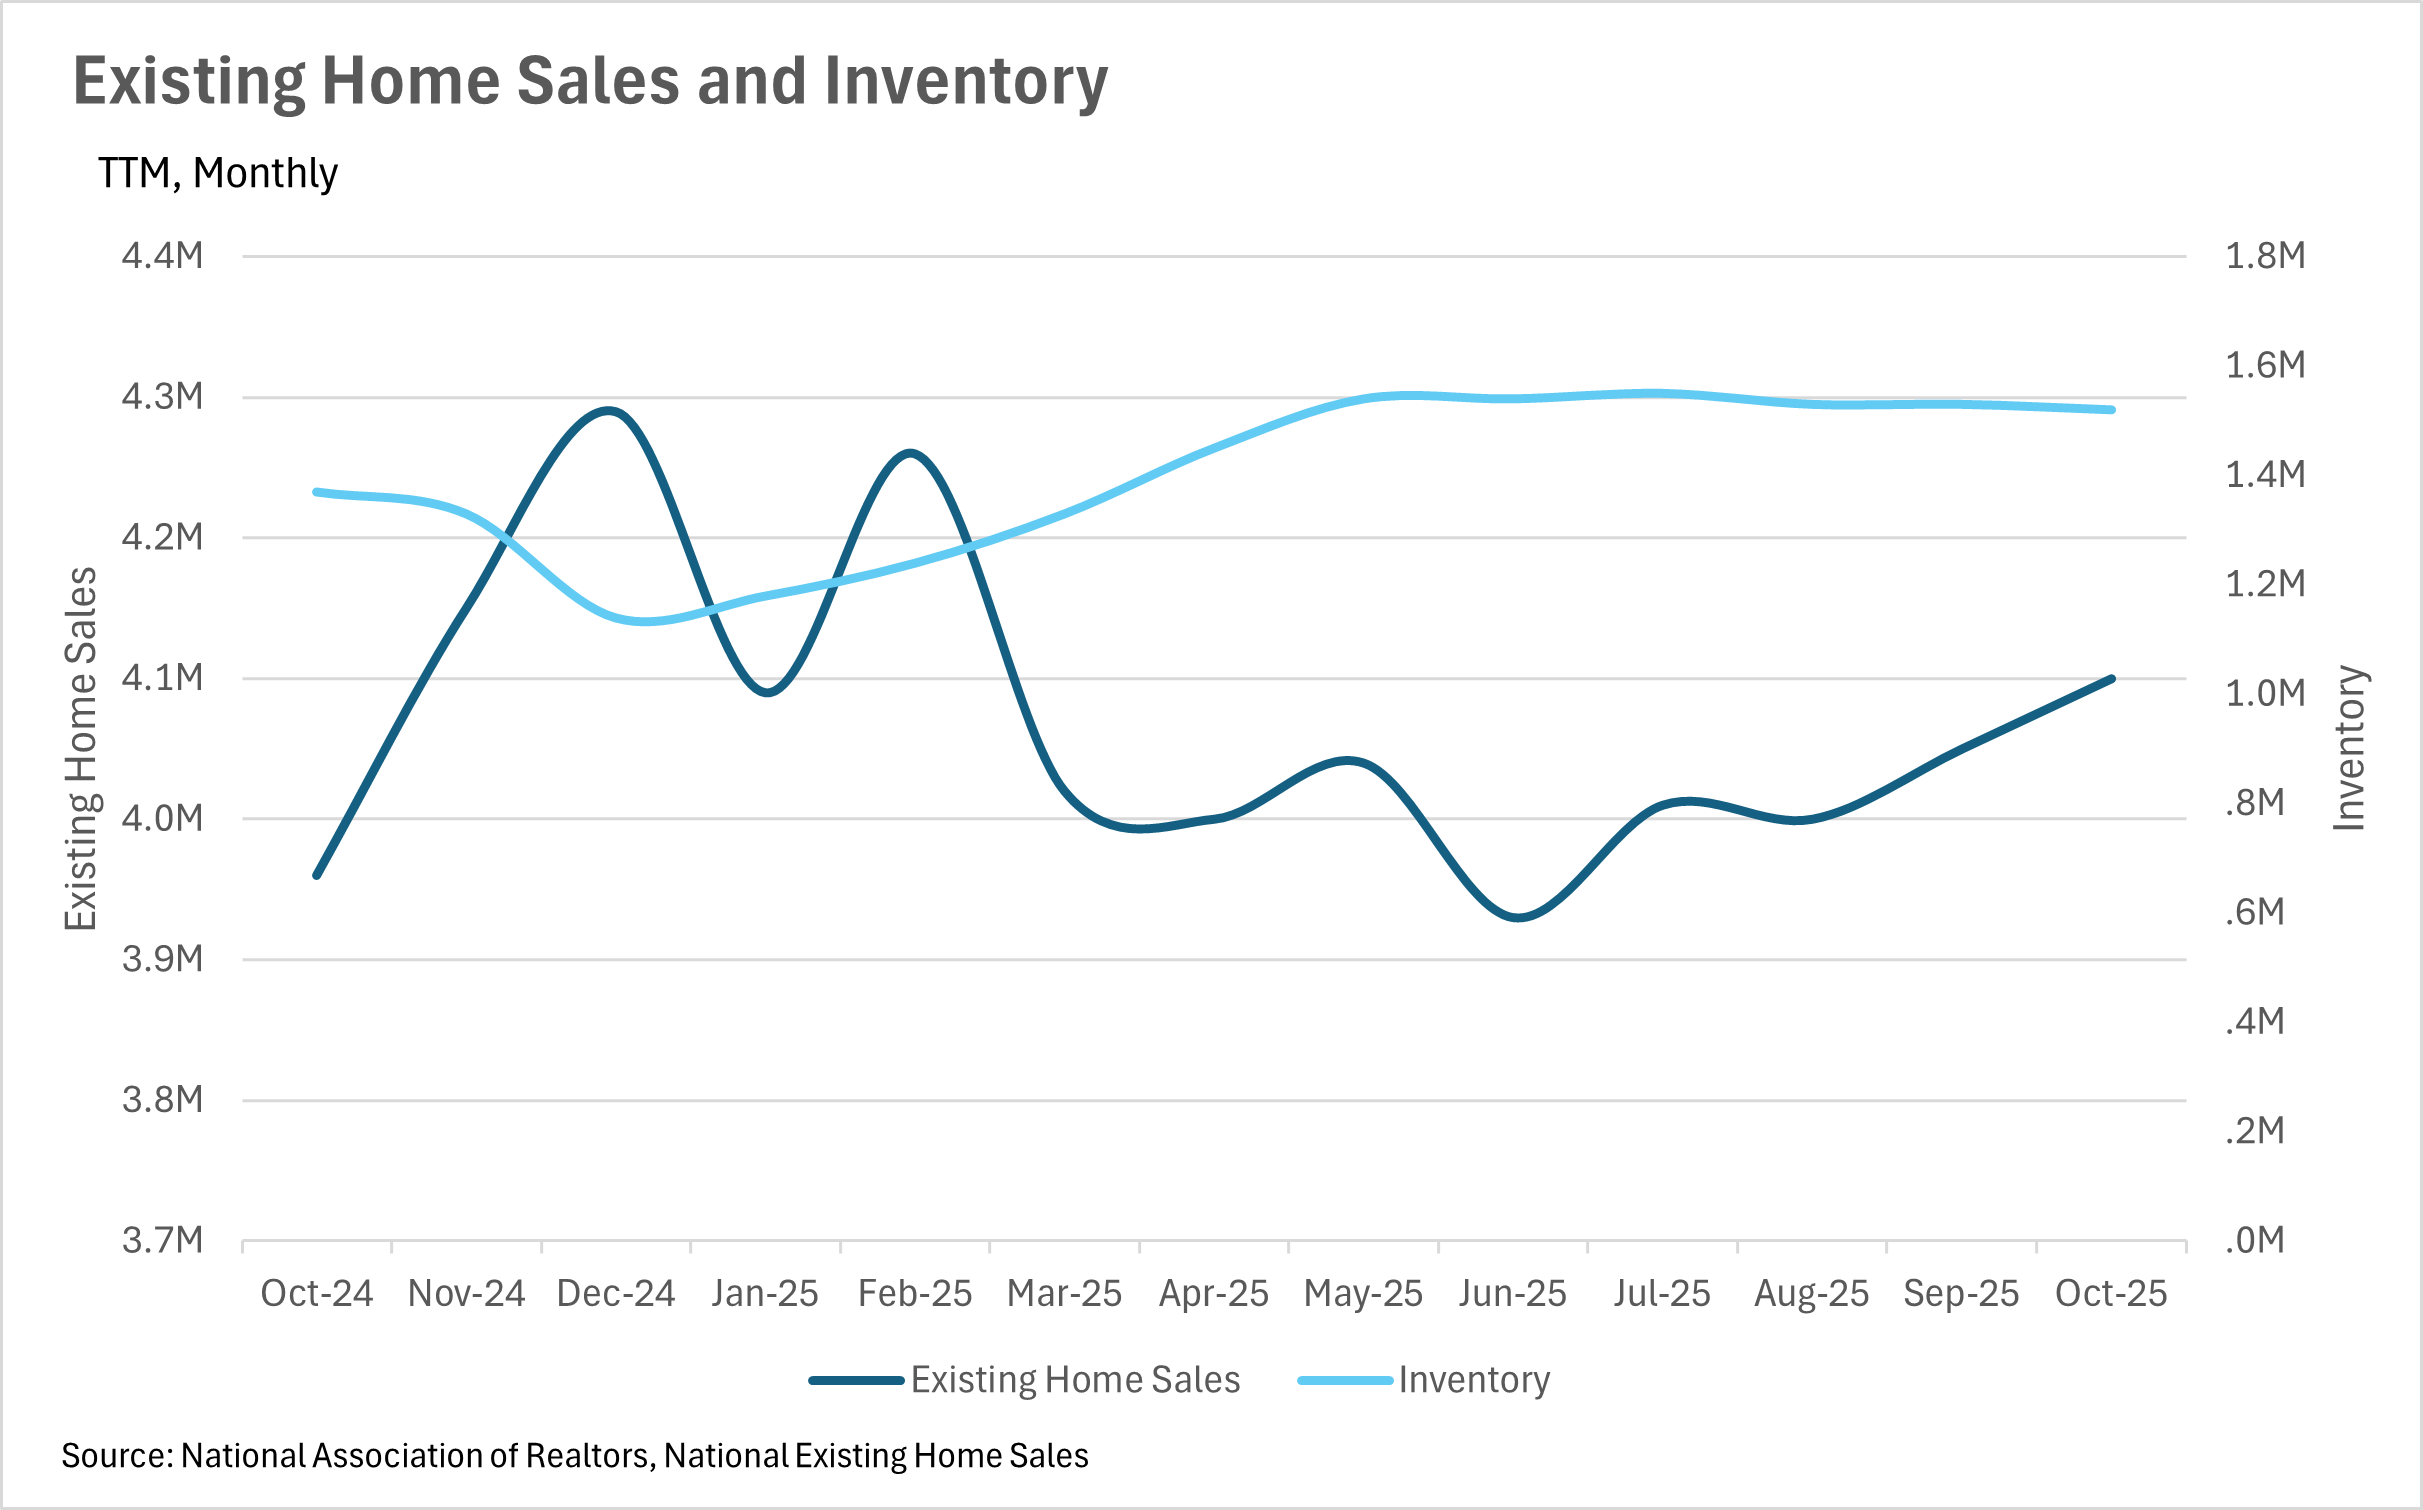
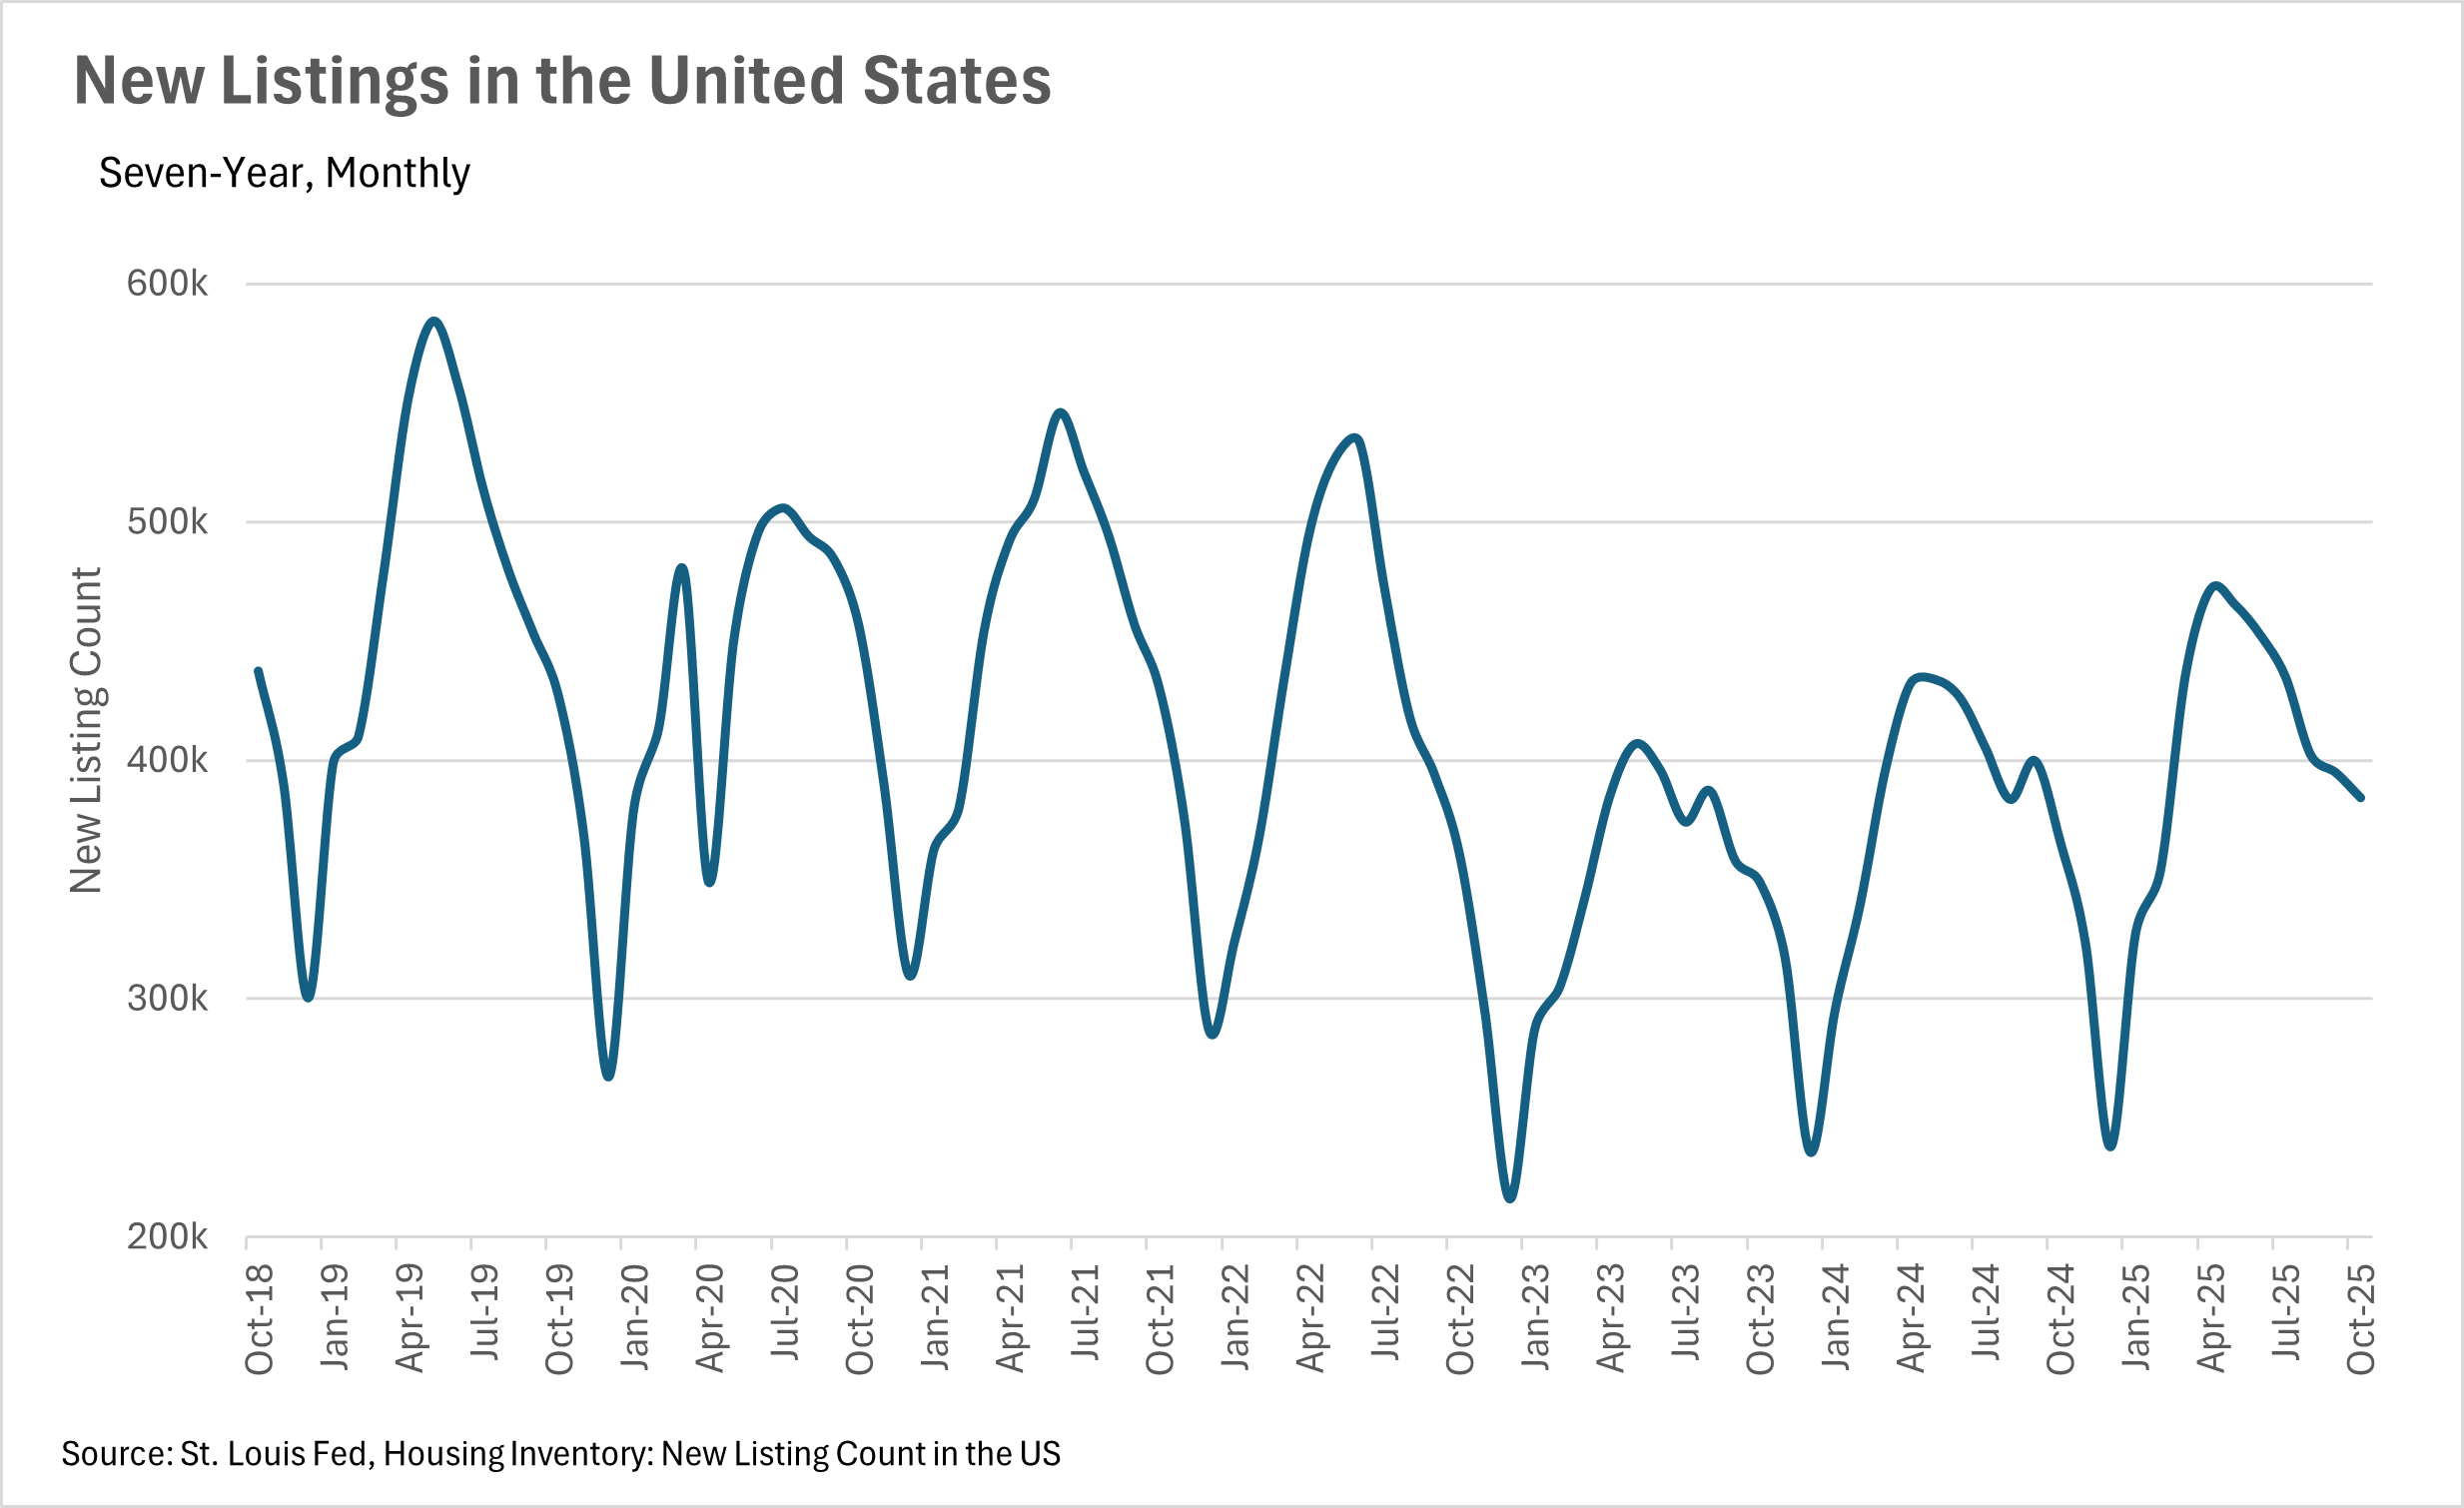
Inventory levels have remained remarkably steady throughout the entire year
Throughout much of the year, inventories at a national level have remained remarkably steady, with most months hovering near the 1.5 million mark. With that being said, in the month of October, we saw inventory levels at roughly 1,520,000, representing a 10.95% increase on a year-over-year basis. During that same time period, we saw more than 384,000 new homes hit the market, representing an increase of 5.08% on a year-over-year basis. We also saw the median sale price for a home increase by 2.06%, bringing the median home value to $415,200.
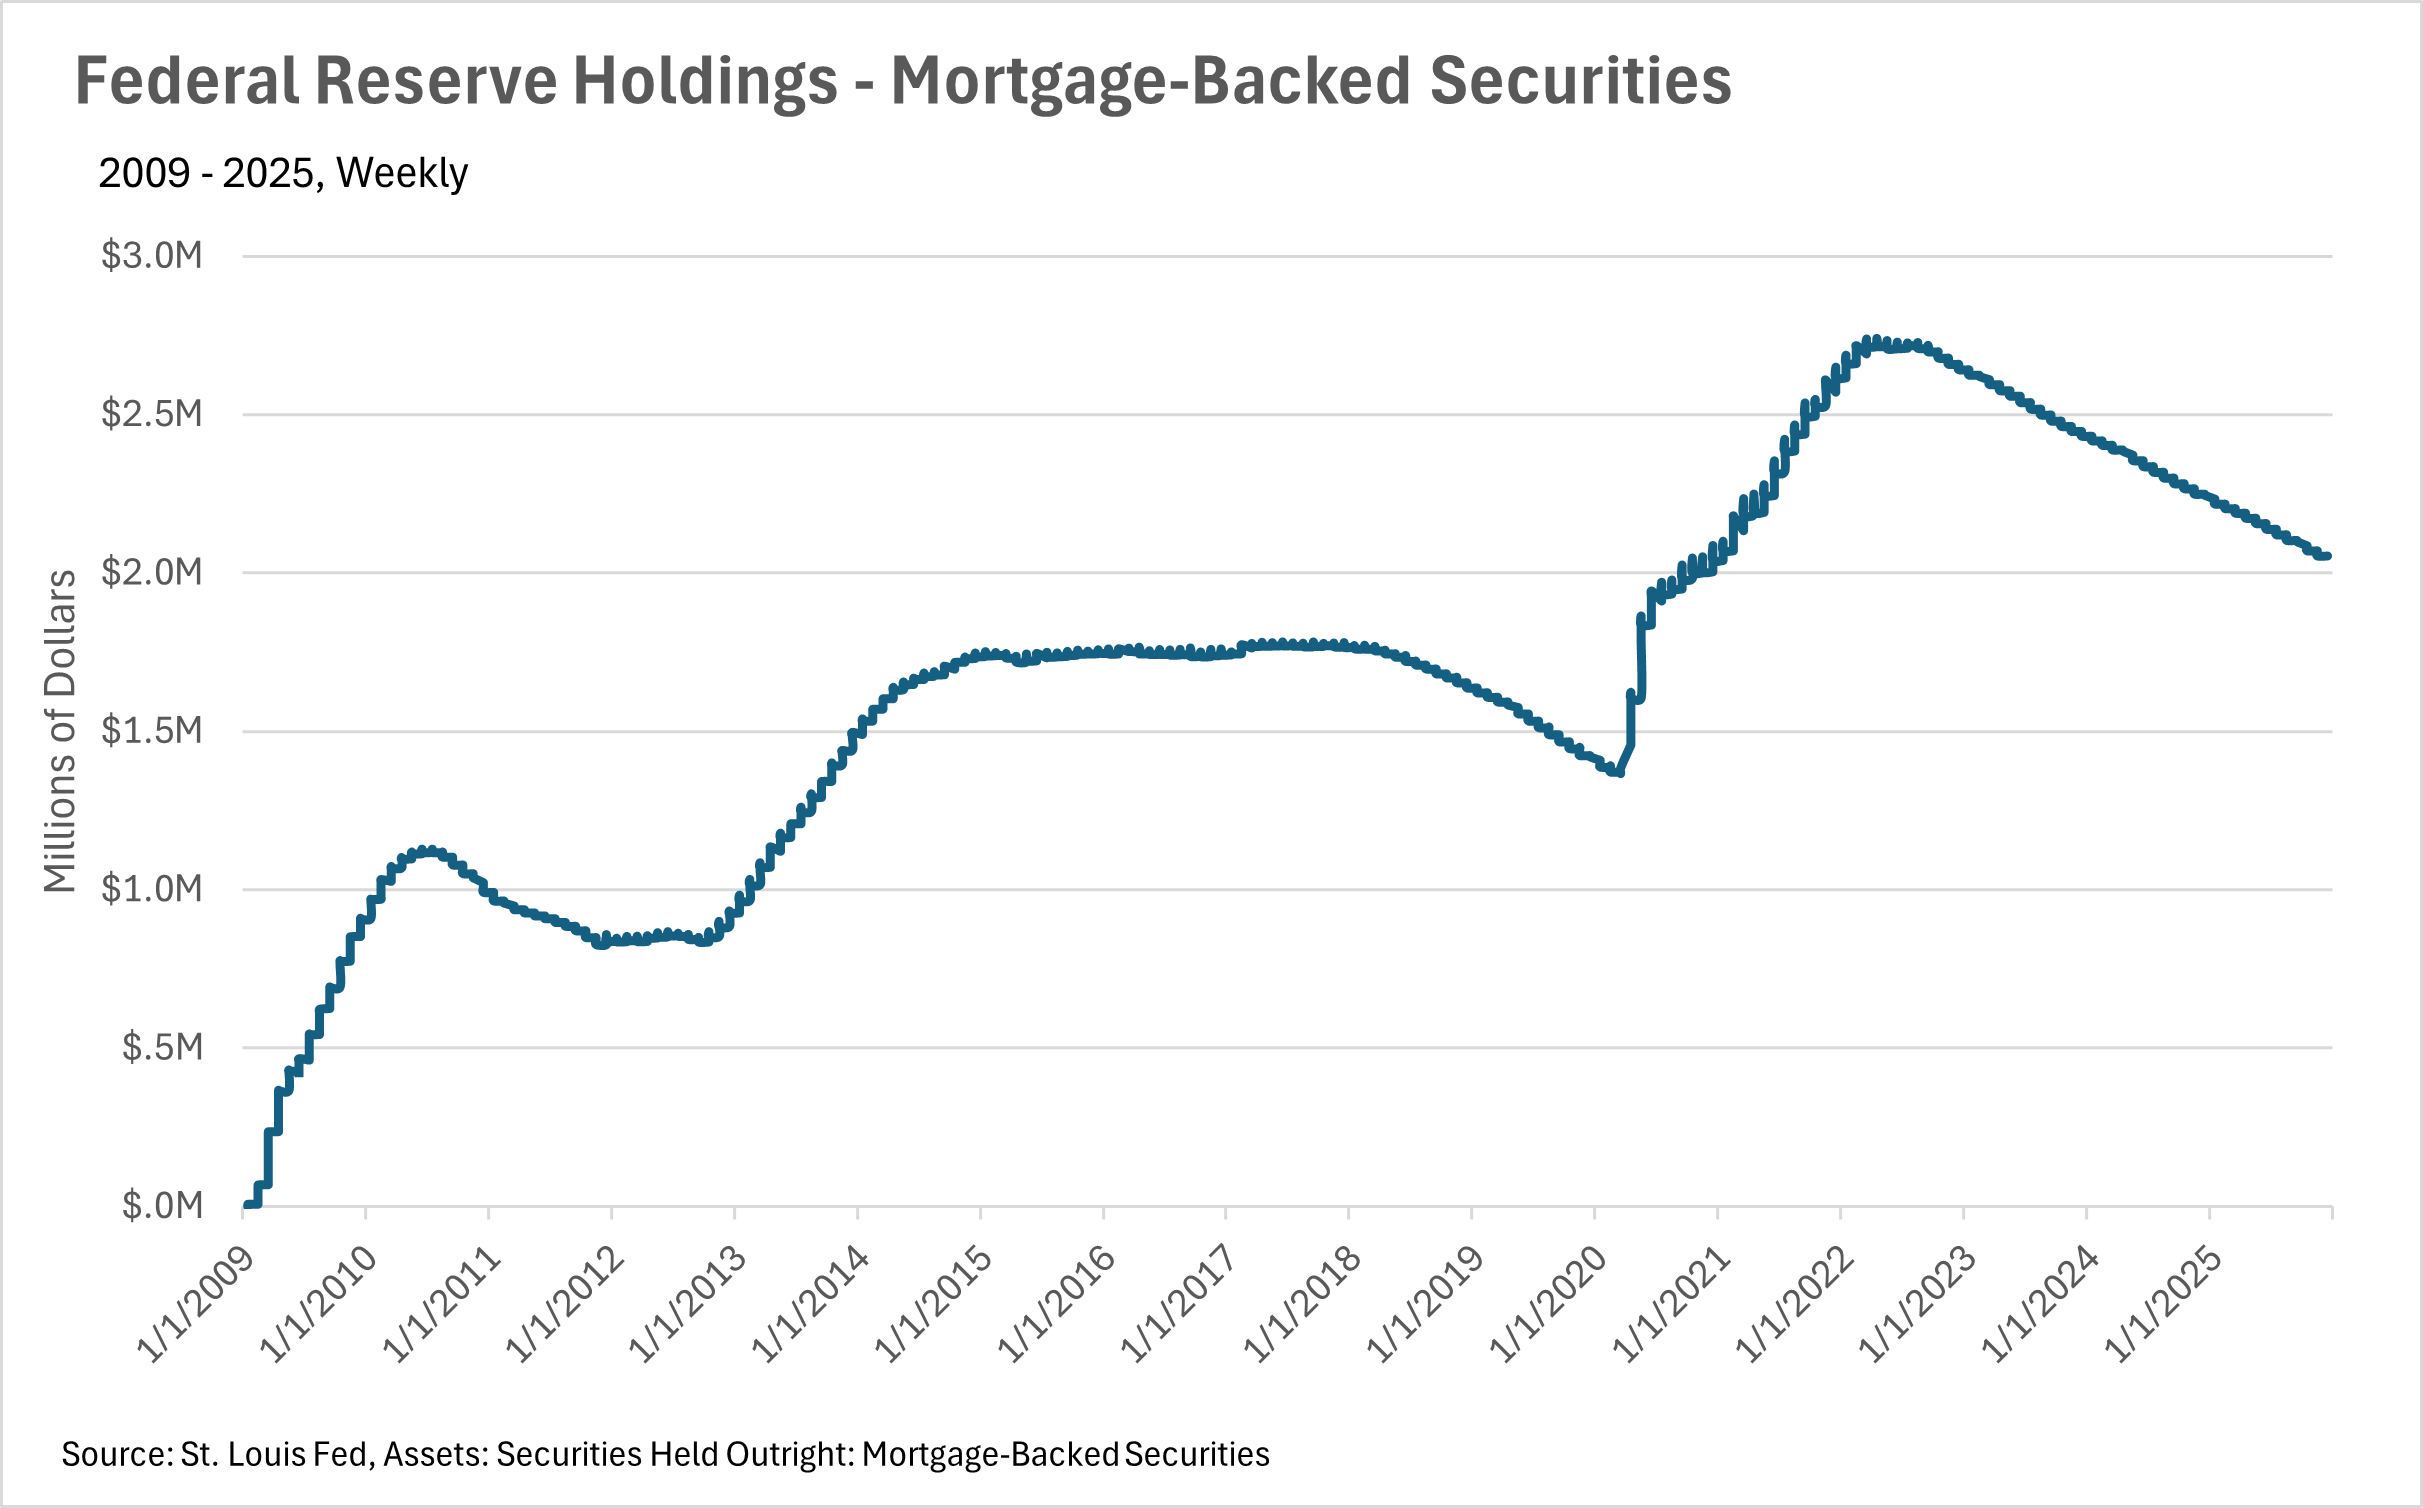
The Fed continues to cut rates, as the broader market faces uncertainty
Right now, we’re in the midst of a relatively interesting period of time, economically speaking. During the government shutdown, not only were there very few publicly released economic datapoints, but many offices responsible for collecting data were unable to. This means we’re receiving economic data that has been tremendously delayed. Uncertainty like this, of course, does not bode well with countless entities, like lenders, markets, and most importantly, the Federal Reserve. Since the Fed is so reliant on public data that has been inaccessible/delayed given the government shutdown, it’s hard to tell what they will do next with interest rates. Luckily for homebuyers and sellers alike, we saw another quarter-point cut in December, but overall, it’s unclear whether or not this cut cycle will continue.
However, this is just what we’re seeing at a national level. As we all know, real estate is incredibly localized, so be sure to check out your local lowdown below!
Big Story Data

The Local Lowdown
Quick Take:
-
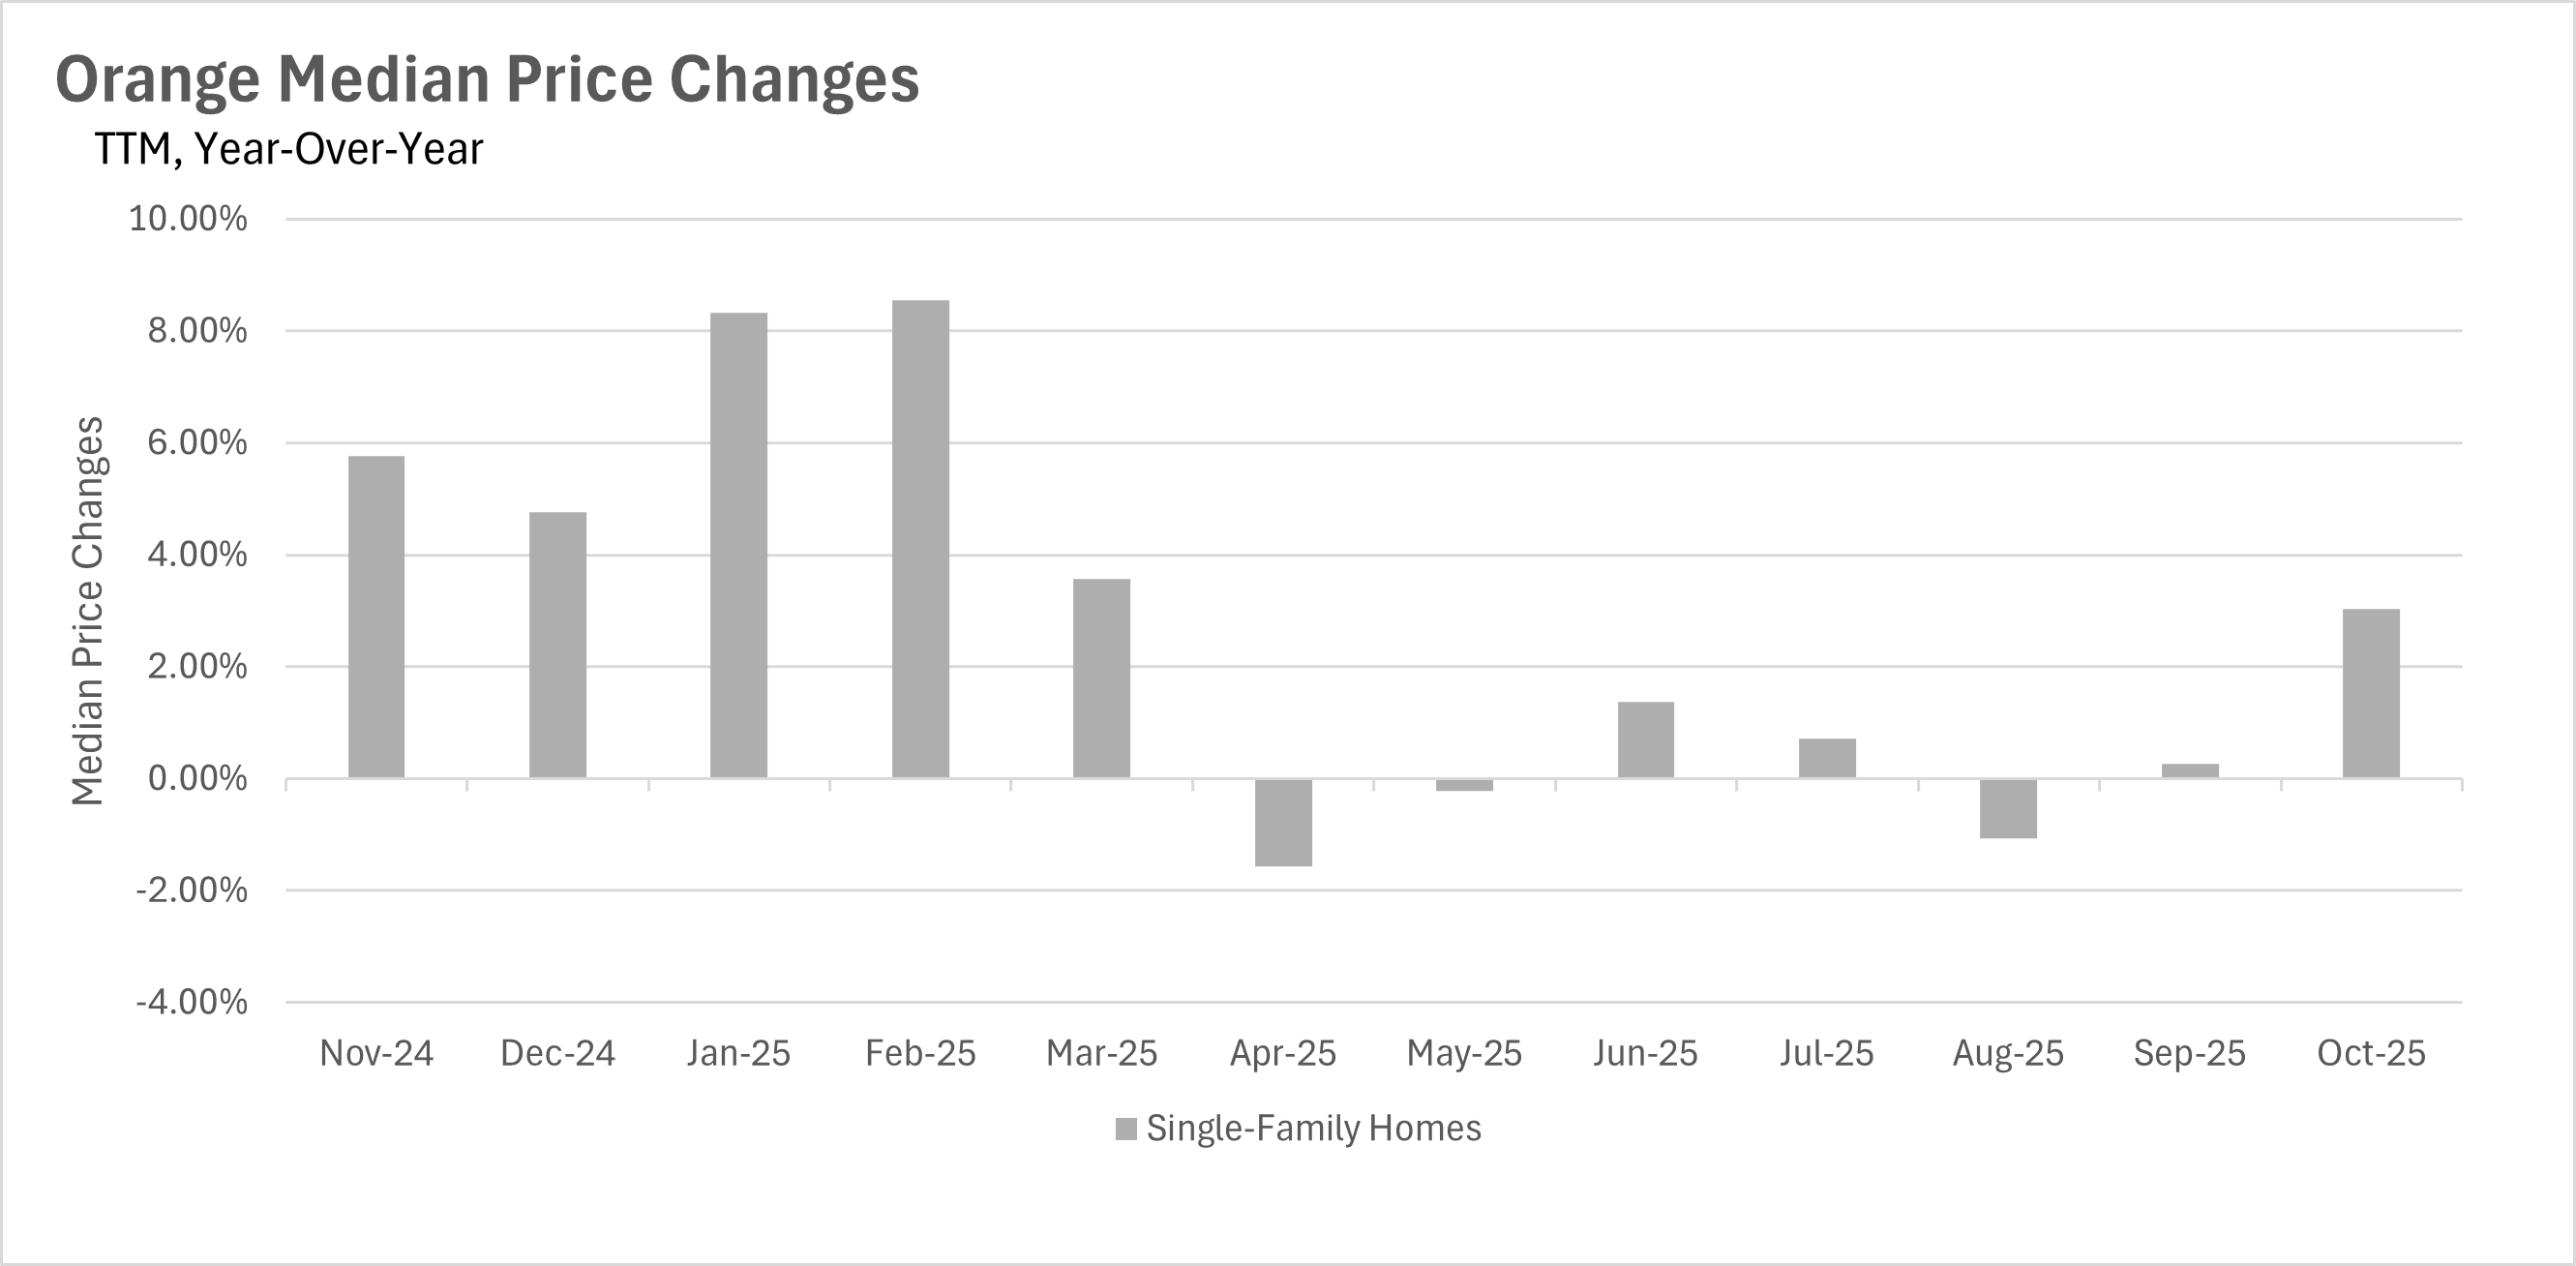
Median sale prices show renewed strength with a 3.04% year-over-year increase in October 2025, marking a return to more robust appreciation.
-
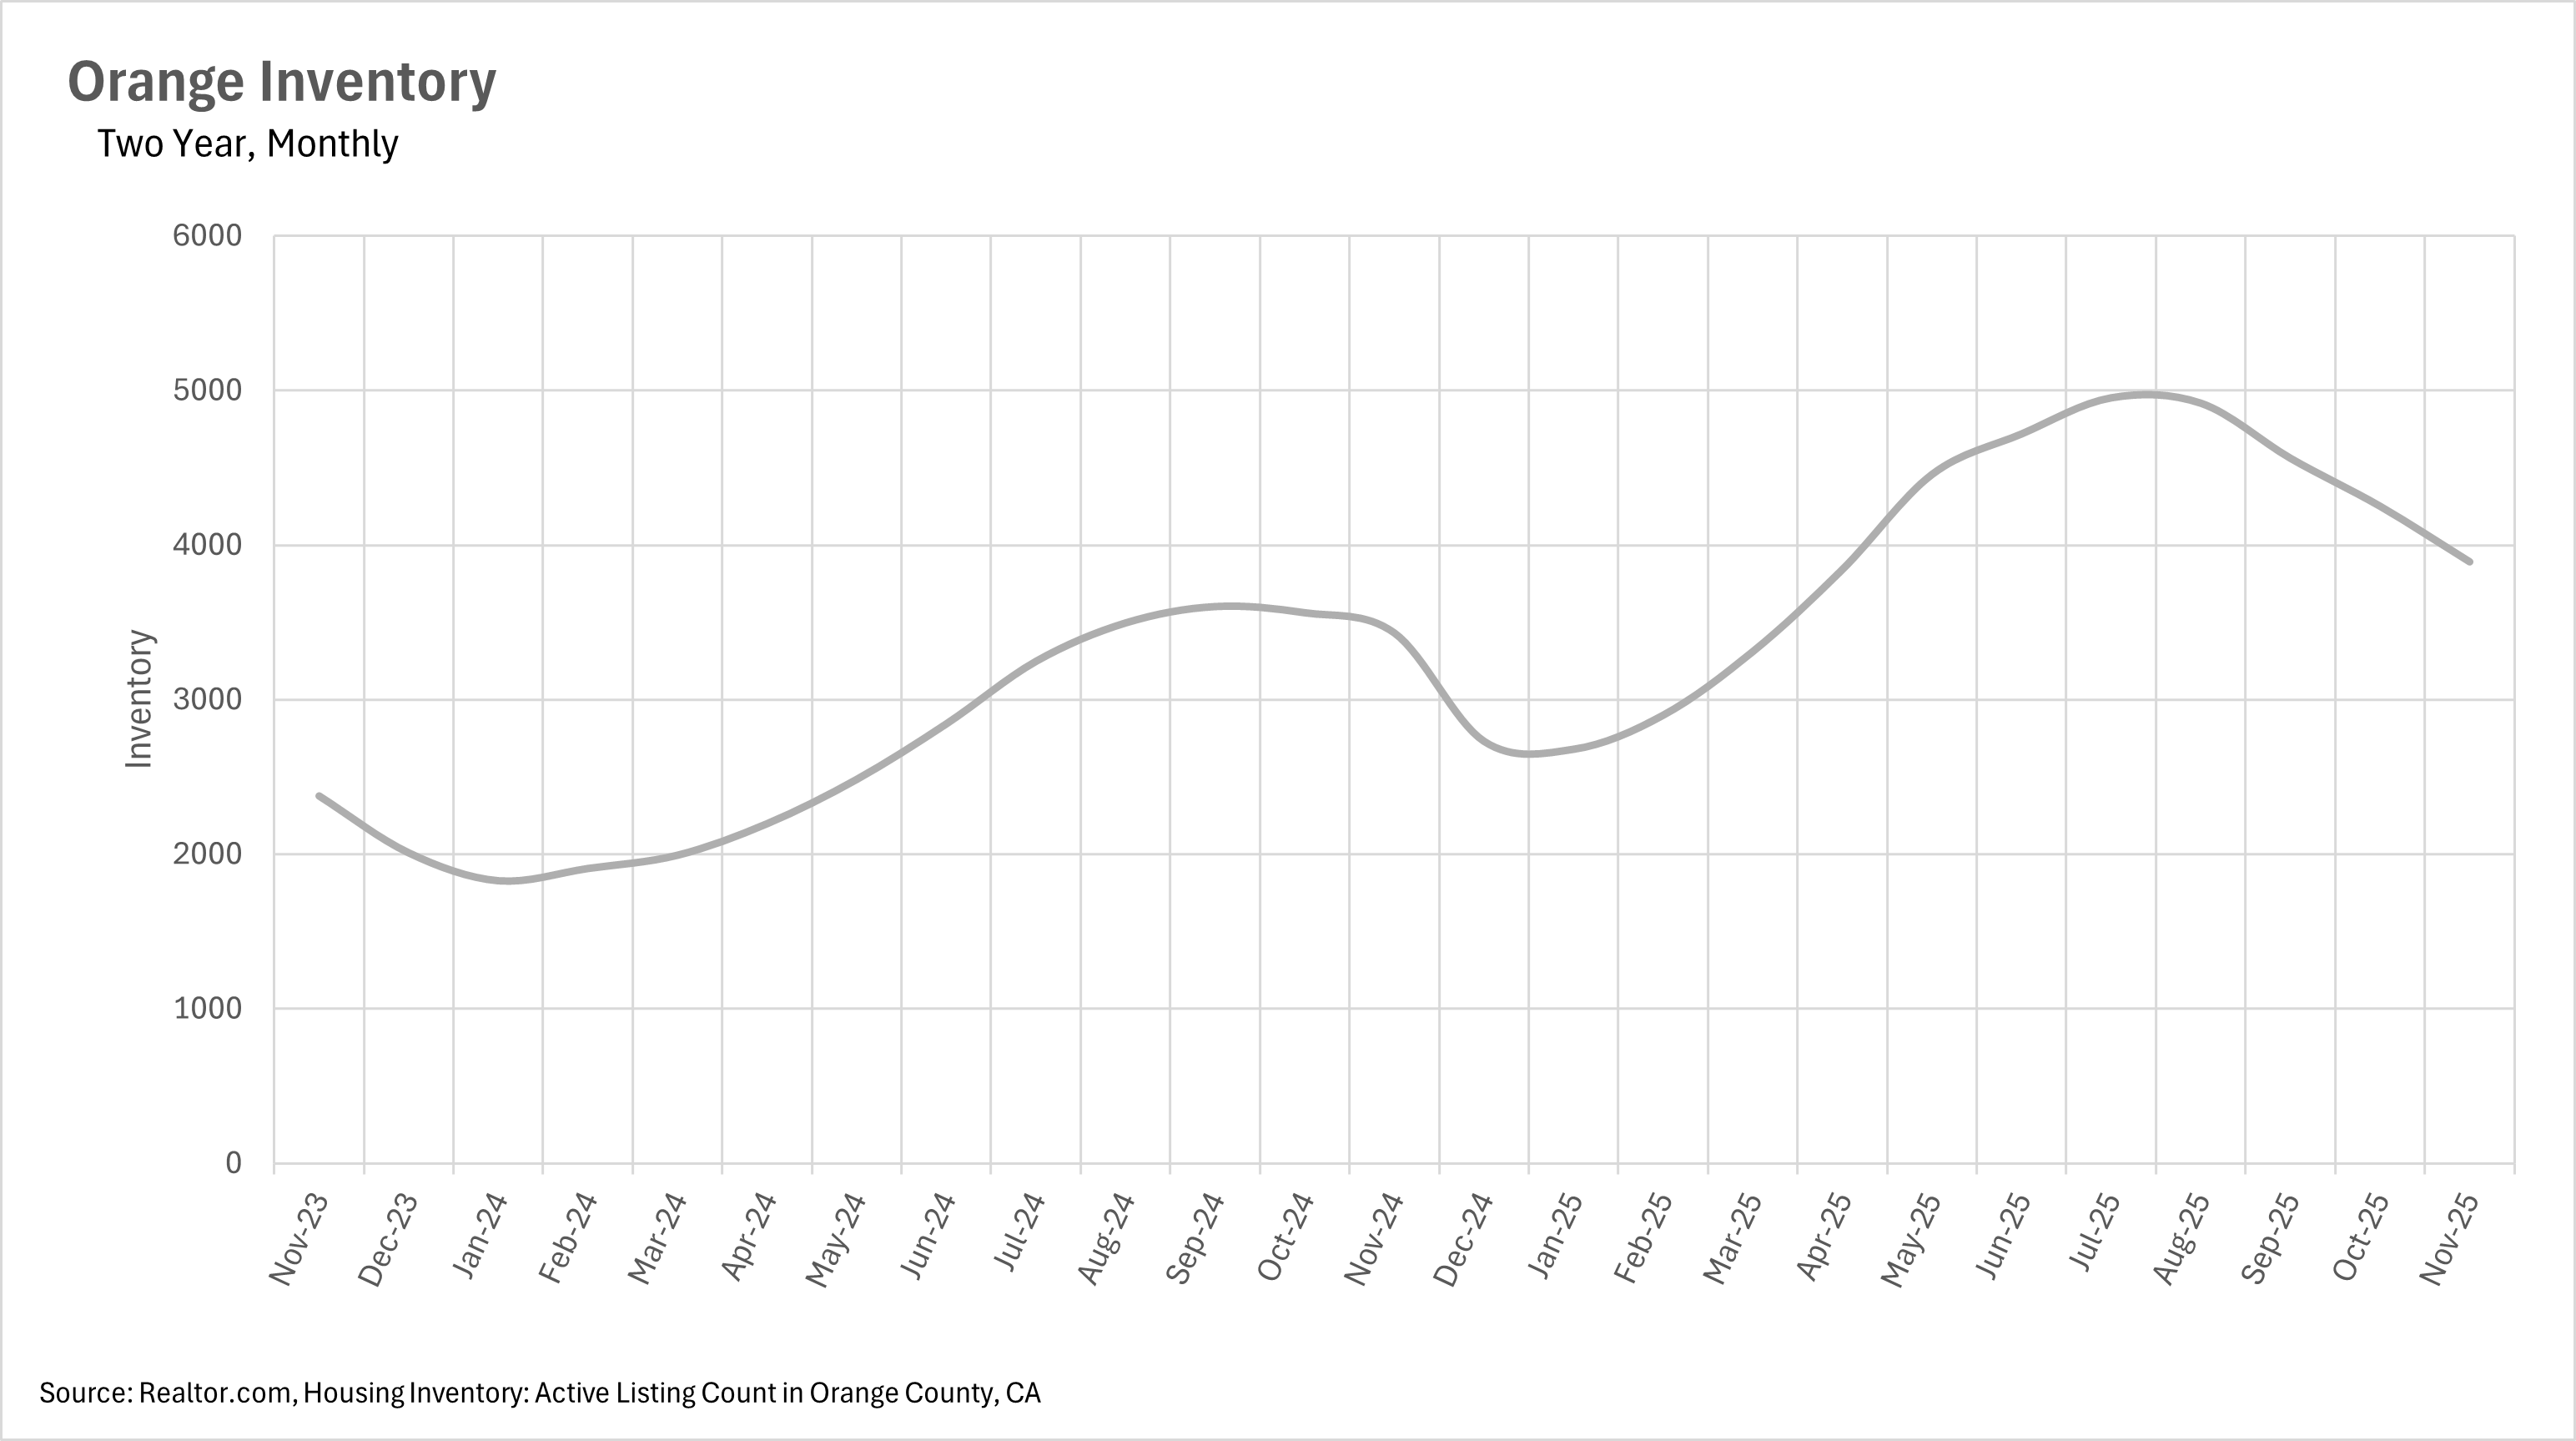
Inventory levels continue their seasonal decline with an 8.45% month-over-month decrease in November, while maintaining a 13.40% year-over-year increase.
-
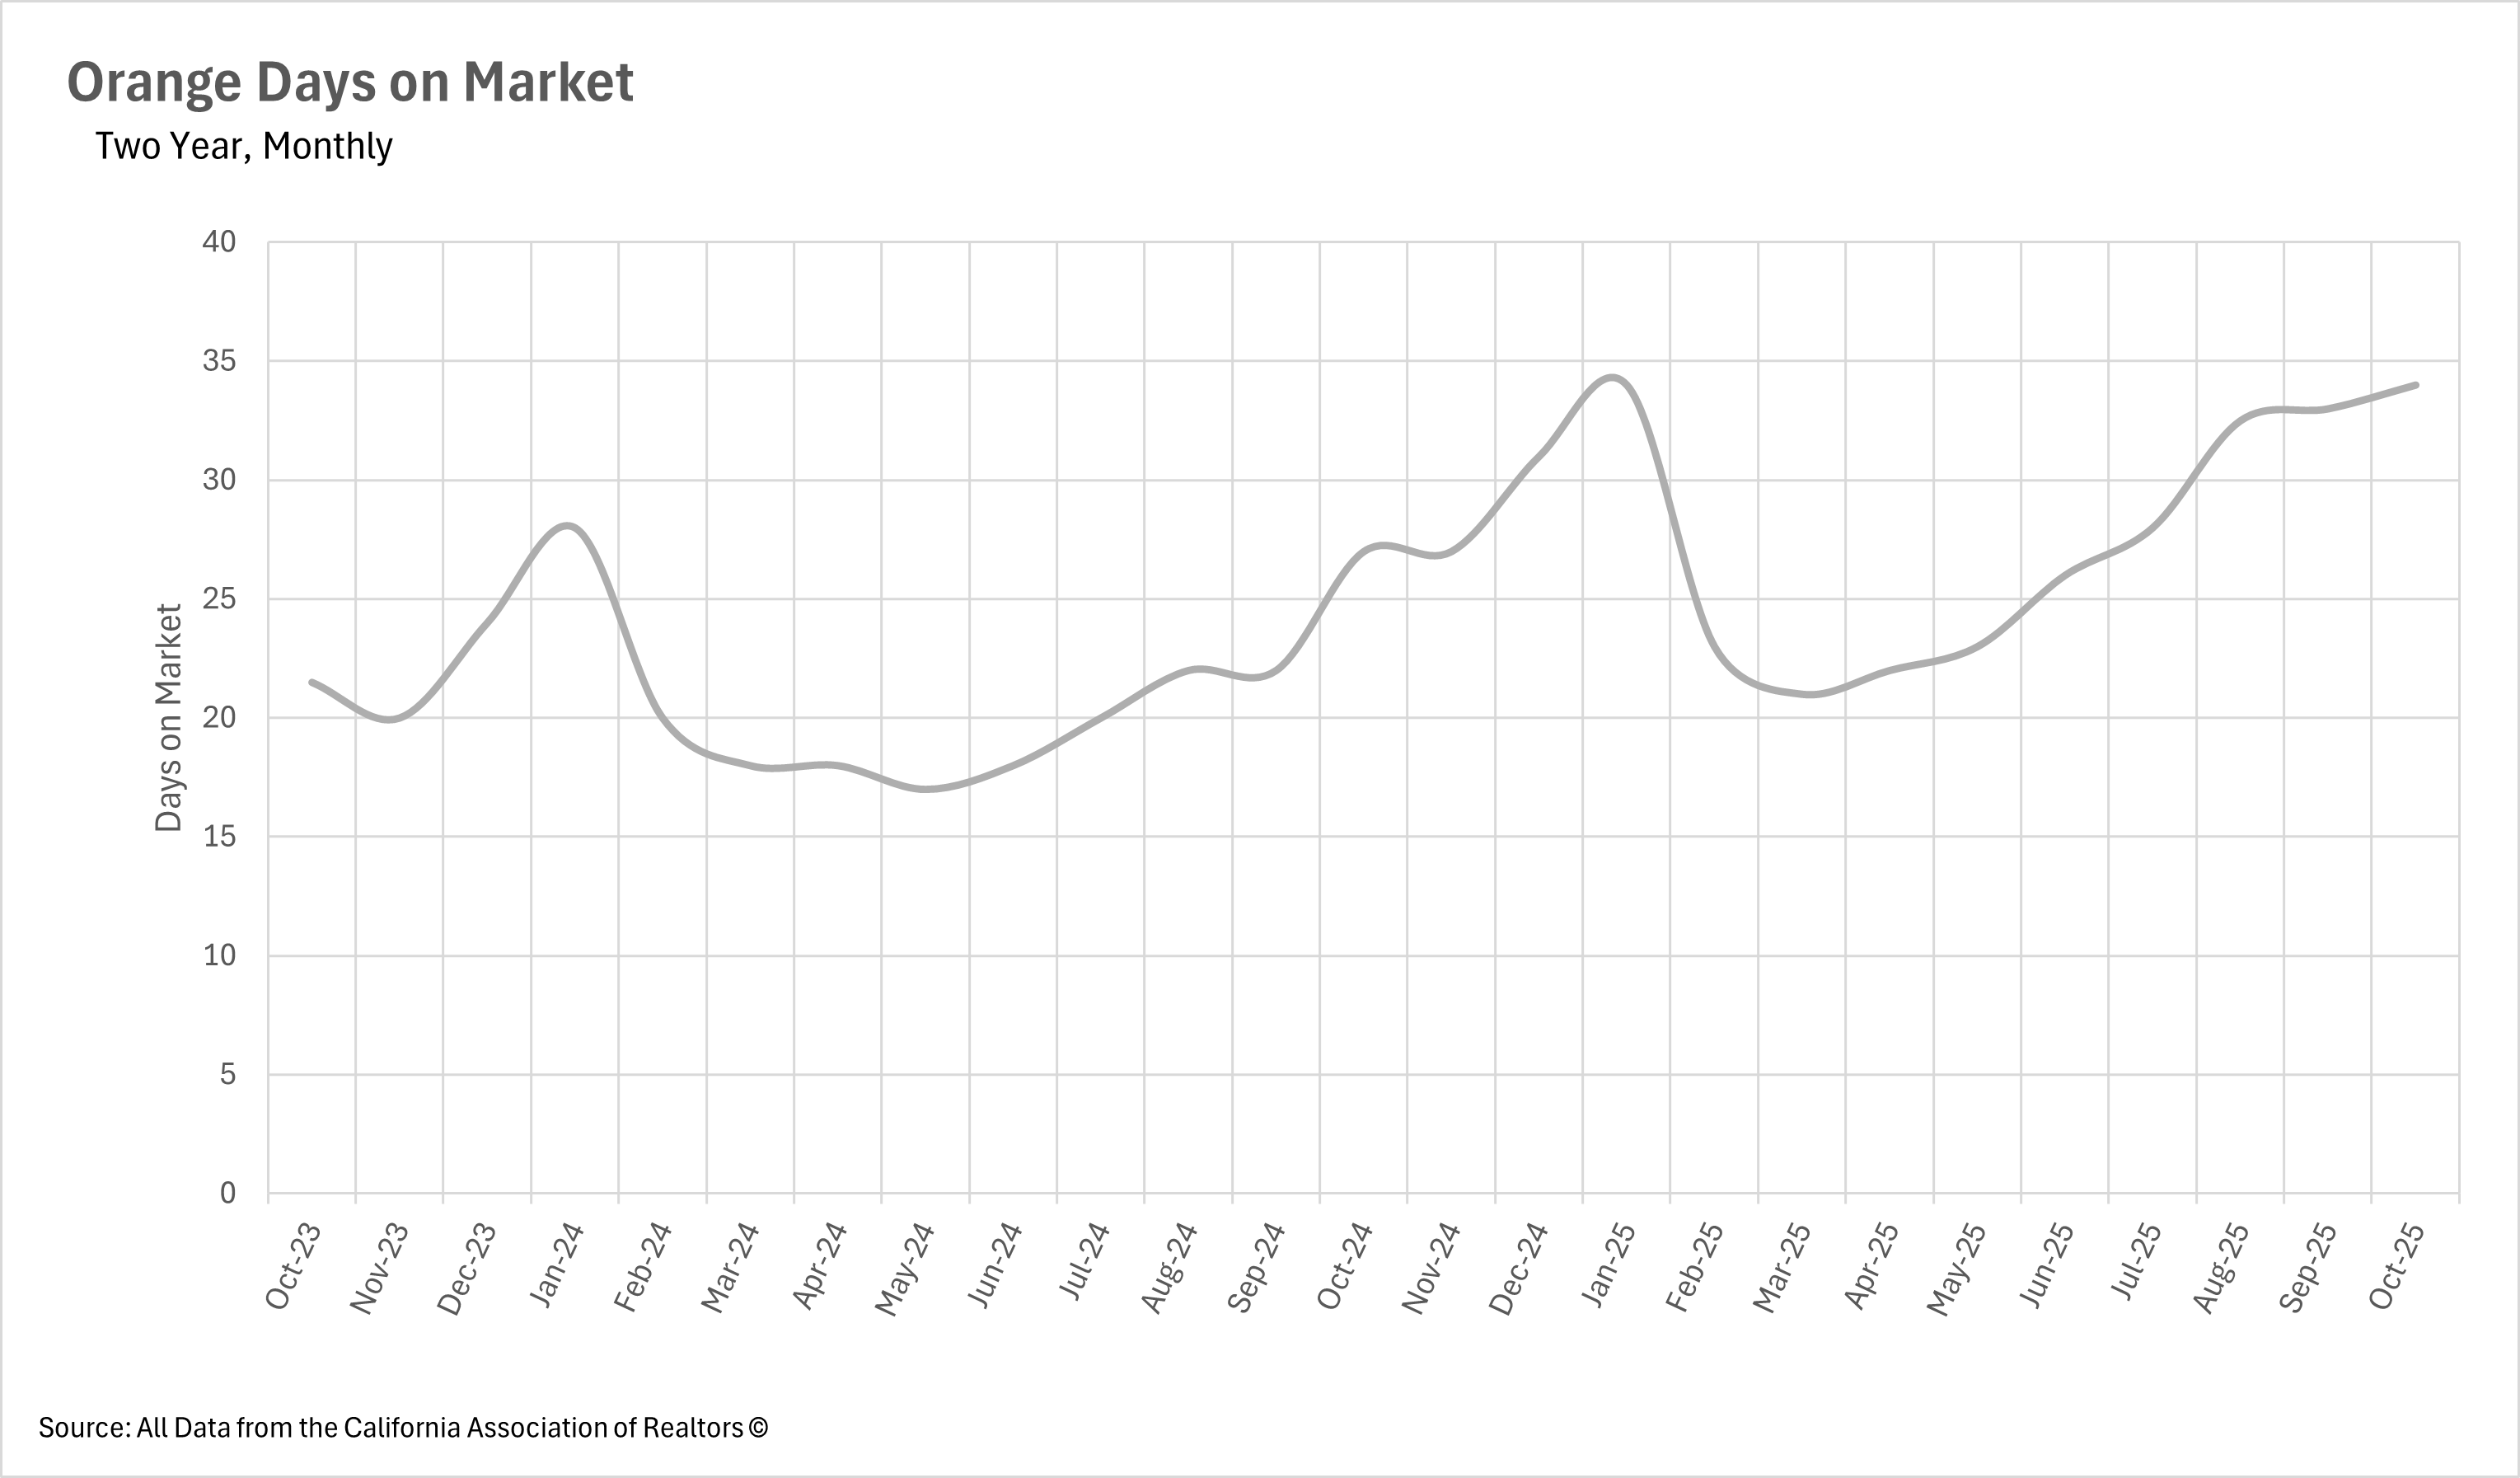
The median listing is now spending 34 days on the market, representing a 25.93% increase compared to the same time last year.
Note: You can find the charts/graphs for the Local Lowdown at the end of this section.
Orange County Prices Regain Momentum in Fall Market
Orange County's housing market has shown renewed strength in pricing after months of near-stagnant growth. October 2025 saw the median single-family home selling for $1,391,000, representing a 3.04% increase compared to October 2024's $1,350,000. This marks the strongest year-over-year growth since March 2025 and represents a significant improvement from the minimal 0.27% growth seen in September. However, the median price did show a slight month-over-month decline of 0.73% from September's $1,401,250, suggesting that while annual comparisons are improving due to easier year-ago comps, month-to-month pricing remains somewhat volatile. This combination of positive annual growth and modest monthly fluctuation suggests the market has found a new pricing equilibrium that balances buyer caution with sustained underlying demand.
Inventory Accelerates Seasonal Decline as Year-End Approaches
Orange County's housing inventory is experiencing an accelerated seasonal retreat as we move toward the traditionally slower winter months. The latest data for November 2025 shows 3,892 single-family homes on the market, representing a substantial 8.45% month-over-month decline from October's 4,251 homes. This marks the fourth consecutive month of declining inventory levels, with the rate of decline accelerating from previous months. However, the market still maintains a 13.40% year-over-year increase compared to November 2024's 3,432 homes, meaning buyers continue to have more options available than they did last year. The sustained inventory decline from the summer peak of nearly 5,000 homes demonstrates that seasonal patterns have fully reasserted themselves, though the year-over-year comparison shows the market remains better supplied than the tight conditions of late 2024.
Market Pace Reaches New Peak as Selling Times Continue to Extend
The trend toward dramatically extended selling times has reached yet another new milestone, with properties now taking longer to sell than at any point this year. The median single-family home in Orange County now sits on the market for 34 days before selling, representing a substantial 25.93% increase from October 2024's 27 days. This also reflects a 3.03% month-over-month increase from September's 33-day average, indicating that even as inventory declines seasonally, selling times continue to edge higher. This extended timeline demonstrates that while the market may be returning to more balanced supply conditions, buyers have not relinquished their negotiating leverage and continue to take their time evaluating properties and conducting thorough due diligence. For sellers, this means that even in a declining inventory environment, patience remains essential to achieving successful transactions.
Orange County Trends Back Toward Sellers' Market Territory
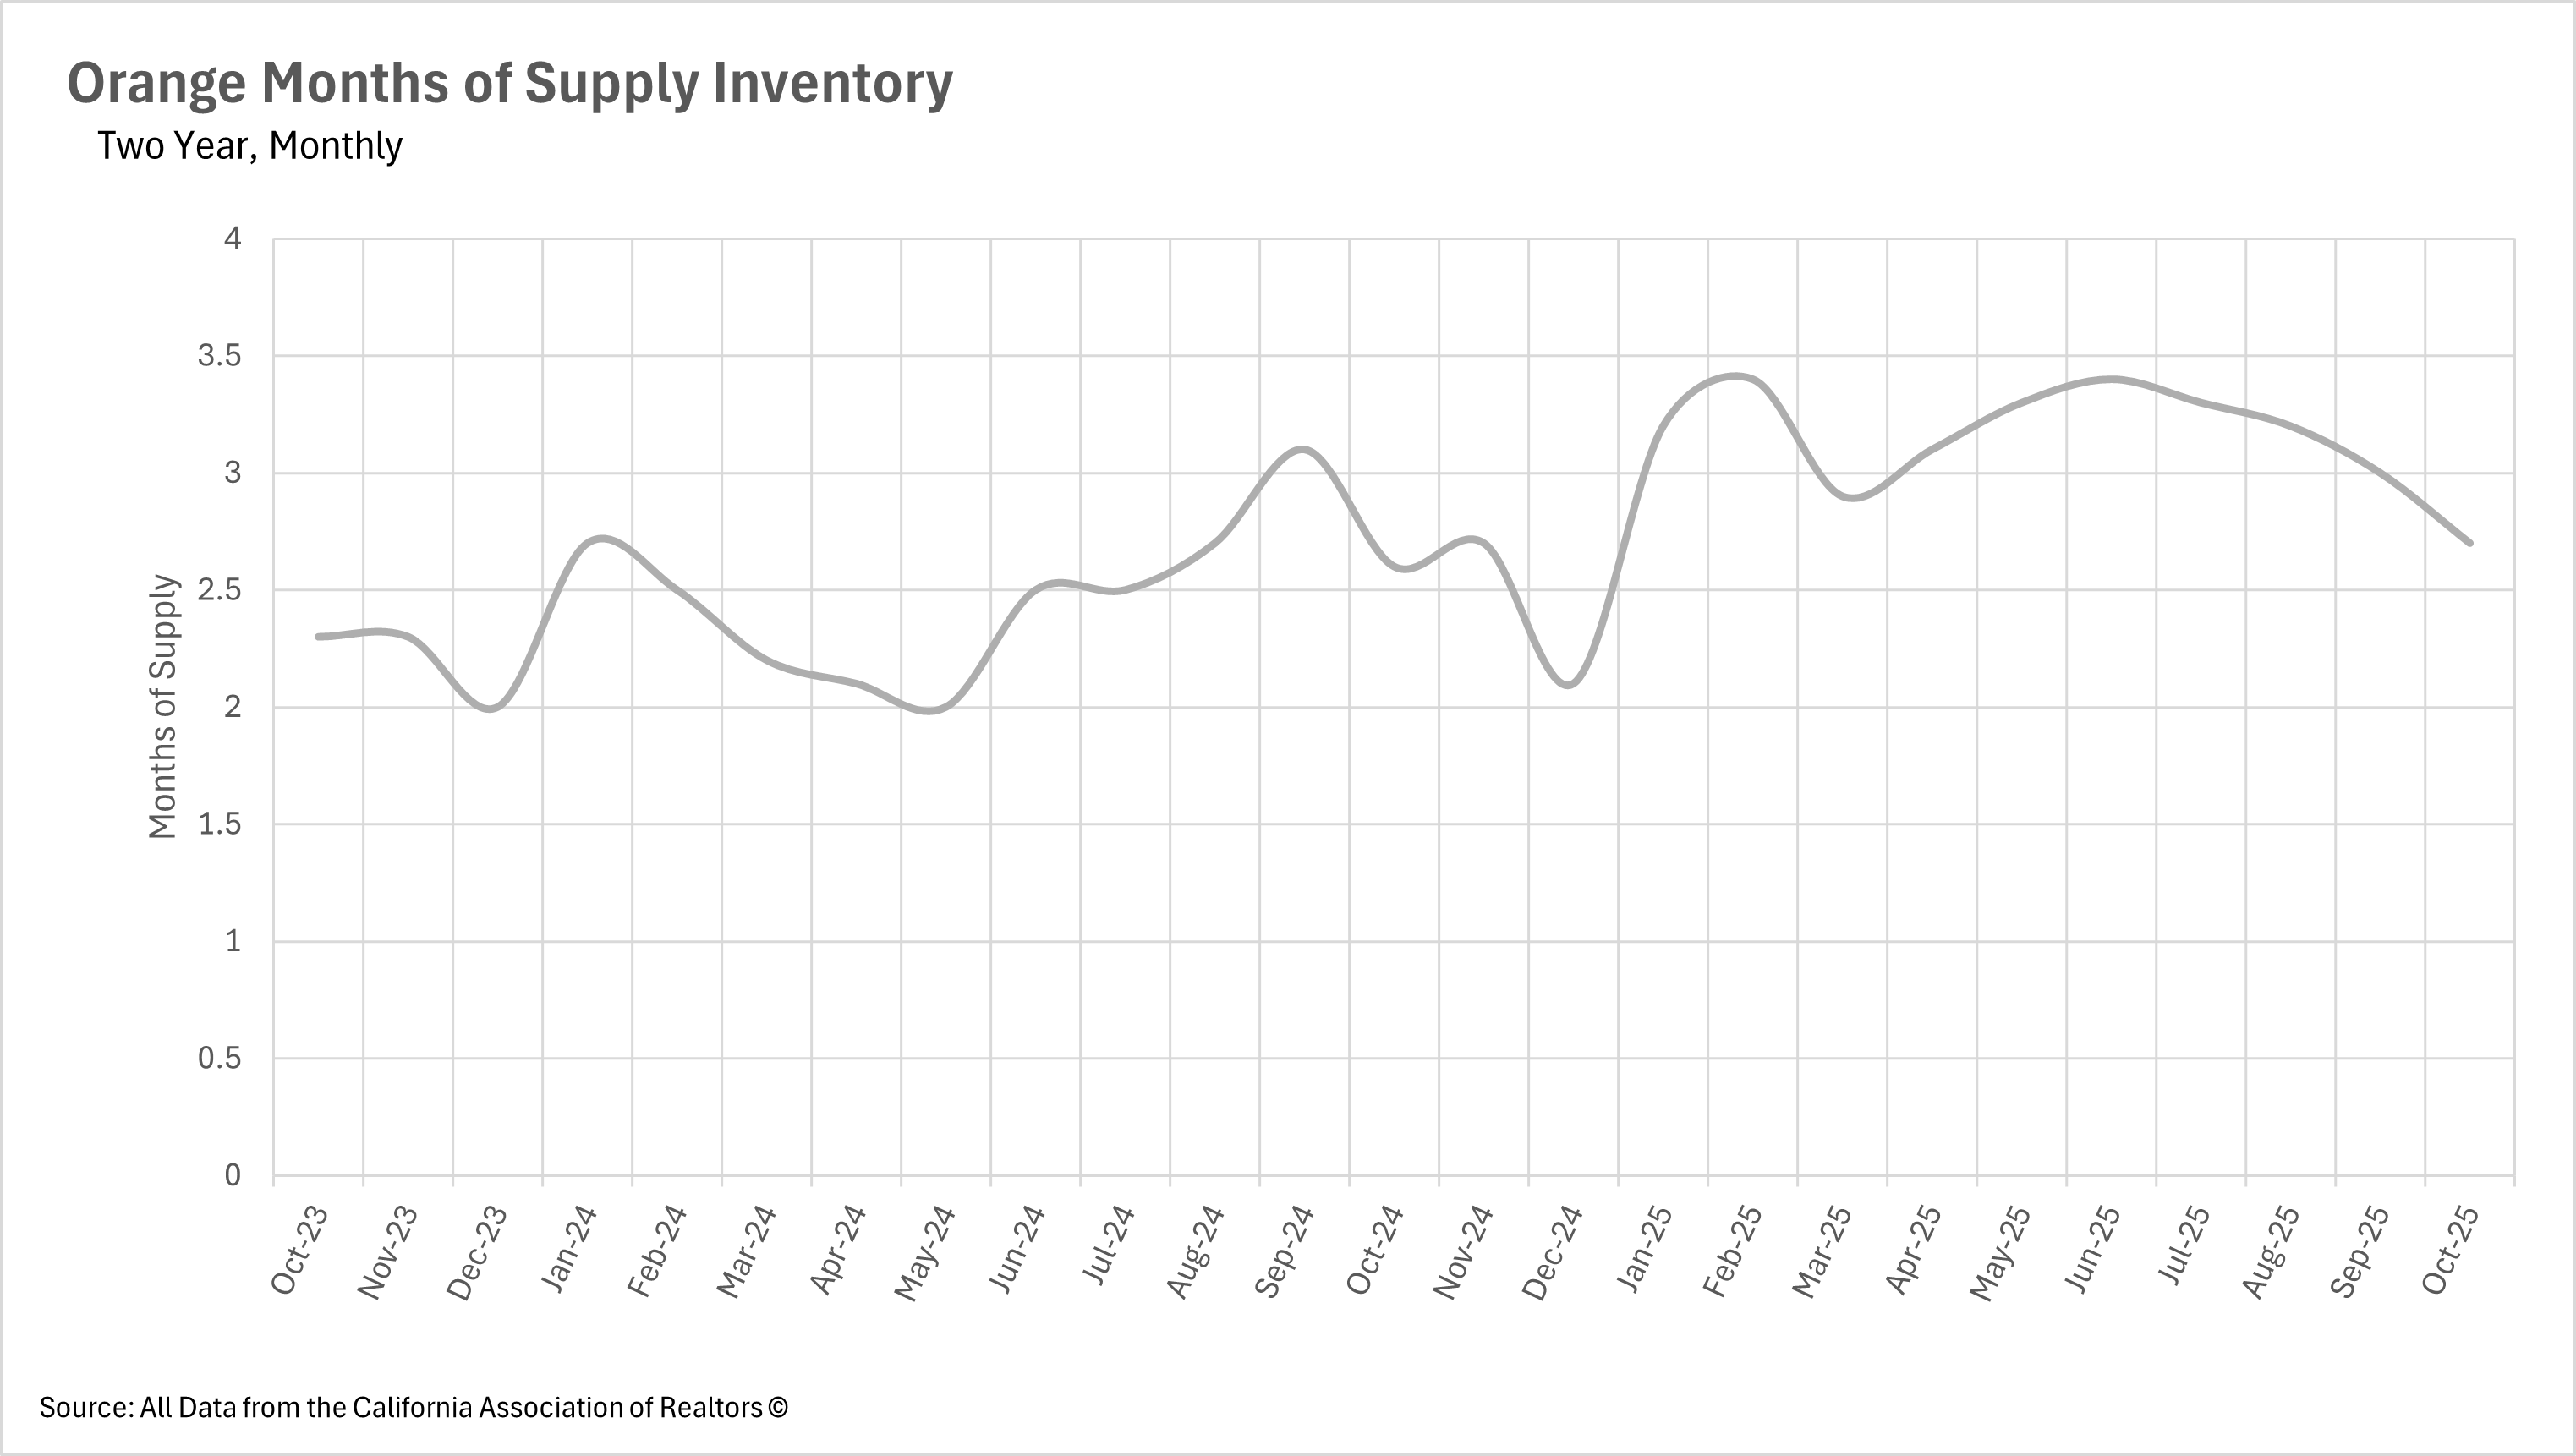
When determining whether a market is a buyers' market or a sellers' market, we look to the Months of Supply Inventory (MSI) metric. The state of California has historically averaged around three months of MSI, so any area with at or around three months of MSI is considered a balanced market. Any market that has lower than three months of MSI is considered a sellers' market, whereas markets with more than three months of MSI are considered buyers' markets.
With 2.7 months of supply inventory in October 2025, Orange County is trending back toward sellers' market territory as the seasonal inventory decline takes effect. This represents a significant 10% month-over-month decrease from September's 3.0 months and a modest 3.85% year-over-year increase from October 2024's 2.6 months of supply. The sharp monthly decline in MSI demonstrates that the market is normalizing more quickly than many expected, with the traditional fall slowdown in new listings outpacing the slowdown in buyer demand. While the market spent much of the summer in buyers' market territory, the current trajectory suggests we may see a return to the seller-favorable conditions that characterized much of 2024, particularly as we move into the lower-inventory winter months.