The Big Story
Quick Take:
- Mortgage rates have ticked back up to roughly the same levels, as they were at prior to the Fed issuing its first rate cut in September.
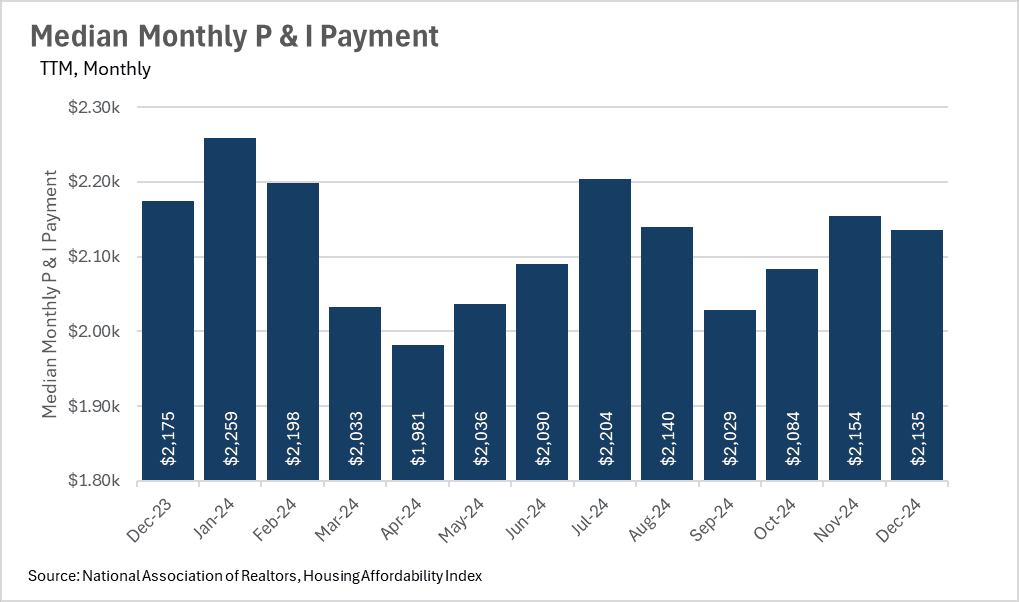
- Although housing affordability remains a concern, things have gotten slightly better year-over-year, with median monthly P&I payment decreasing by 1.84%.
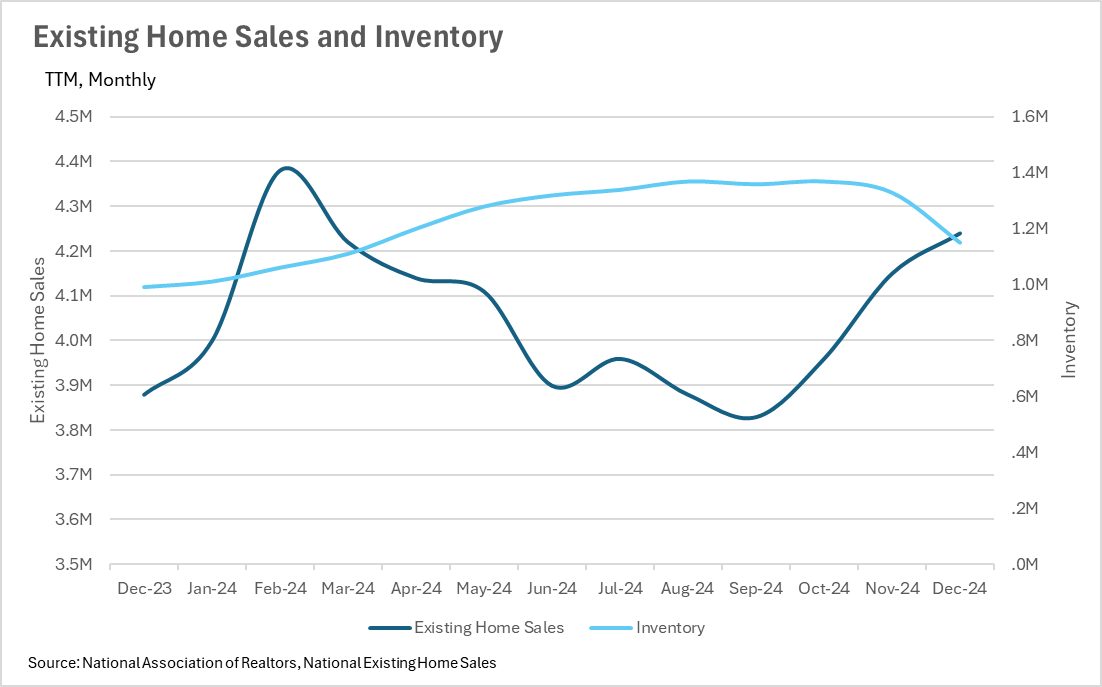
- Year-over-year growth in inventory is outpacing existing home sales by roughly 7%, meaning we could see affordability begin to increase over the coming months.
Note: You can find the charts & graphs for the Big Story at the end of the following section.
*National Association of REALTORS® data is released two months behind, so we estimate the most recent month's data when possible and appropriate.
Mortgage rates have returned to pre-rate cut levels
One very interesting phenomenon that we’ve seen play out over the past few months is that interest rates have largely returned to the levels that we saw prior to the Fed’s first rate cut in September. Unfortunately this is not what the market at large was expecting to see, since mortgage rates typically move in tandem with the Federal Funds rate. However, this suggests that the lending market expects the rate cuts that we have seen recently to be short lived, meaning that the lending market is expecting the Fed to begin increasing rates again within the coming years. This could be due to a variety of reasons, but inflation is the most likely culprit for rate hikes, as it has remained rather stubborn since it first became an issue in 2022.
Inventory is finally starting to build throughout the US
As we all know, inventory levels have been an issue Post-COVID, across the entire country, with many areas not having nearly enough inventory to support buying demand. This, in turn, helped to push up the values of homes nationwide.
It’s important to note though, that we’re beginning to see inventory growth outstrip existing home sale growth, as in December, inventory grew by 16.16% on a year-over-year basis, whereas existing home sales grew by 9.28% year-over-year.
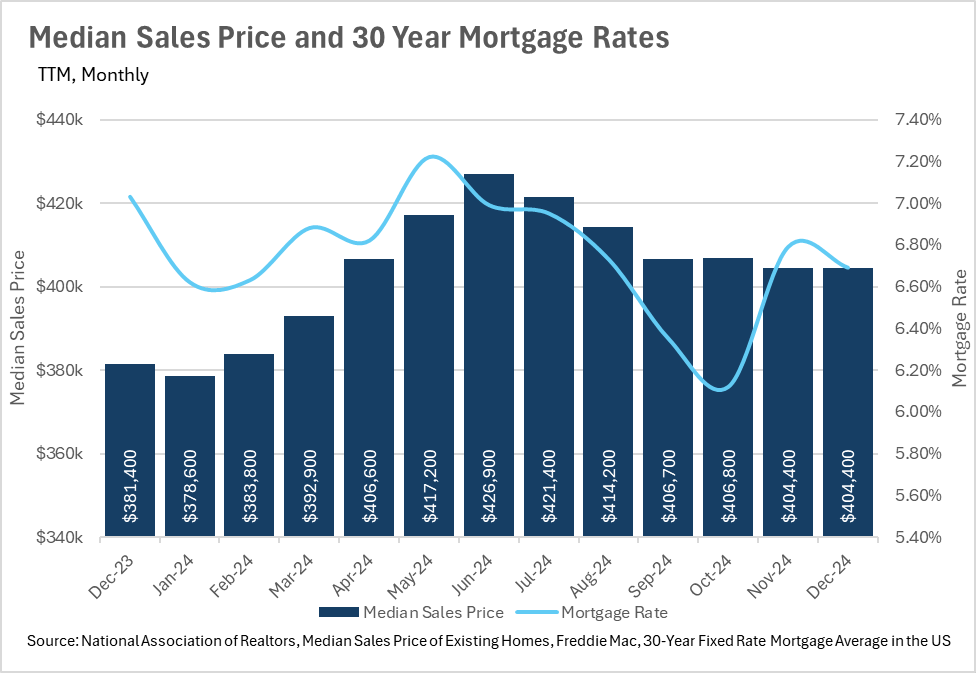
Median sale prices continue to rise, despite interest rate headwinds
Many buyers still have the mortgage rates that they saw in 2021 and 2022 at the top of their mind, making it difficult for them to justify locking in a mortgage in the 6%-7% ranges that we’ve been seeing over the past couple of years. Despite many buyers sitting on the sidelines, and waiting for lower rates, we’re still seeing the median sale price of homes increase.
In both the months of November and December, the median sale price of a home in the United States was $404,400. This represents an increase in value of 6.03%, when compared to the December 2023 median sale price of $381,400. This is slightly concerning, given that the growth in median sales price continues to outstrip the growth in inflation, with December’s year-over-year CPI figures coming in at 2.9%.
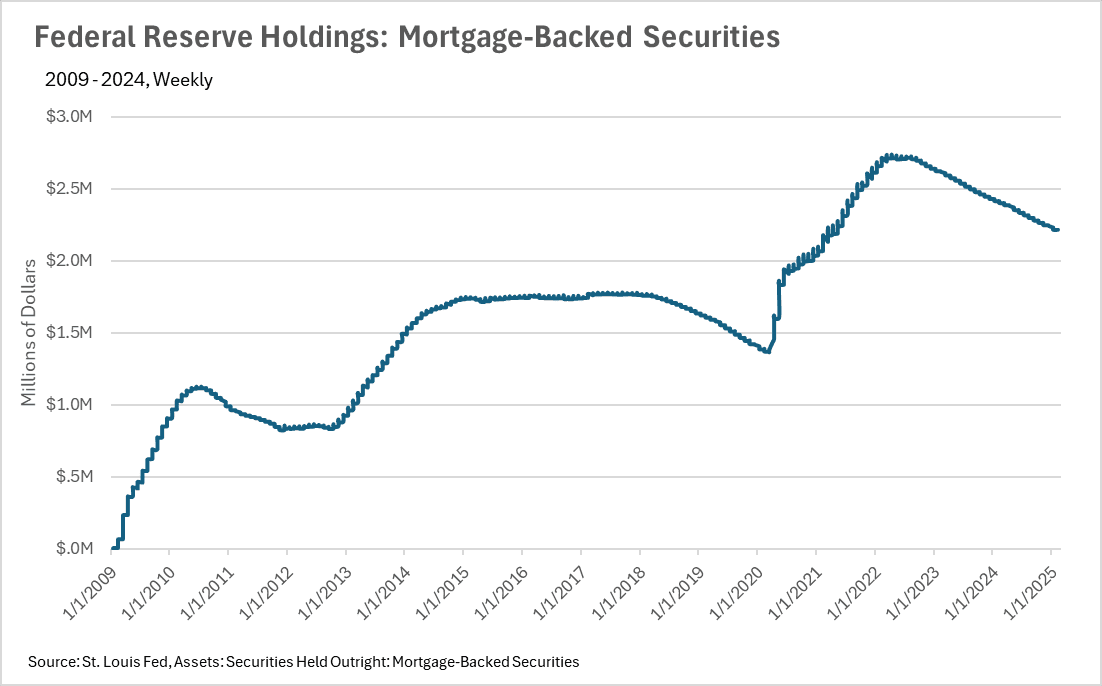
The Fed continues to unwind its mortgage backed securities
As many of us know, in addition to the Federal Funds Rate, the Fed also has control over its own balance sheet. Throughout the COVID crisis, the Fed ramped up its purchase of mortgage backed securities at a rate we haven’t seen since the Great Financial Crisis. However, the Fed has since been unwinding its holdings of MBS’s at a steady rate, since late 2022, which it continues to this day.
How does all of this effect my local market
Although it’s great to know what’s happening at a national level, real estate is an incredibly localized industry. There are areas throughout the country that are doing considerably better or worse than the nation at large. To ensure you’re informed on the happenings at both a national level and a local level, we’ve included our local lowdown below. In our local lowdown, you’ll find the in-depth coverage you need to stay in tune with your area. As always, we’ll be monitoring the housing market and the economy from both a macro and micro level, and report back to ensure you’ve got the data you need to make the best decisions possible!
Big Story Data
The Local Lowdown
Quick Take:
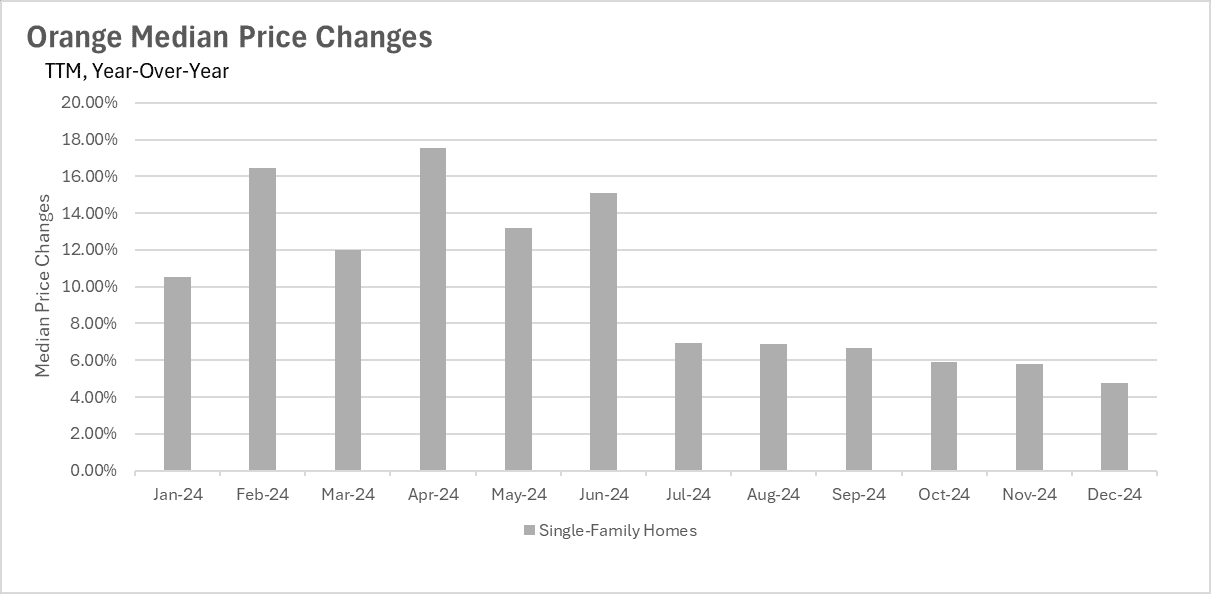
- Median sales price growth is slowing down as we start to approach some higher year-over-year comps.
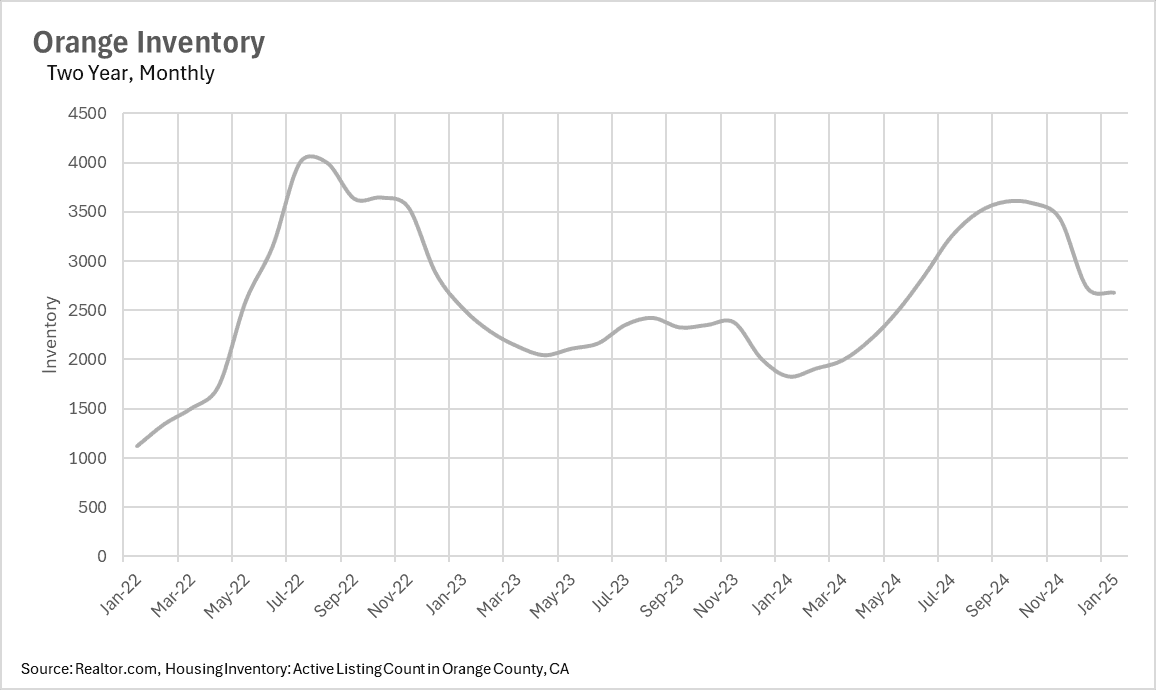
- As with the rest of SoCal, inventory is beginning to pile up in Orange County, as we see year-over-year inventory growth in the mid-double digits!
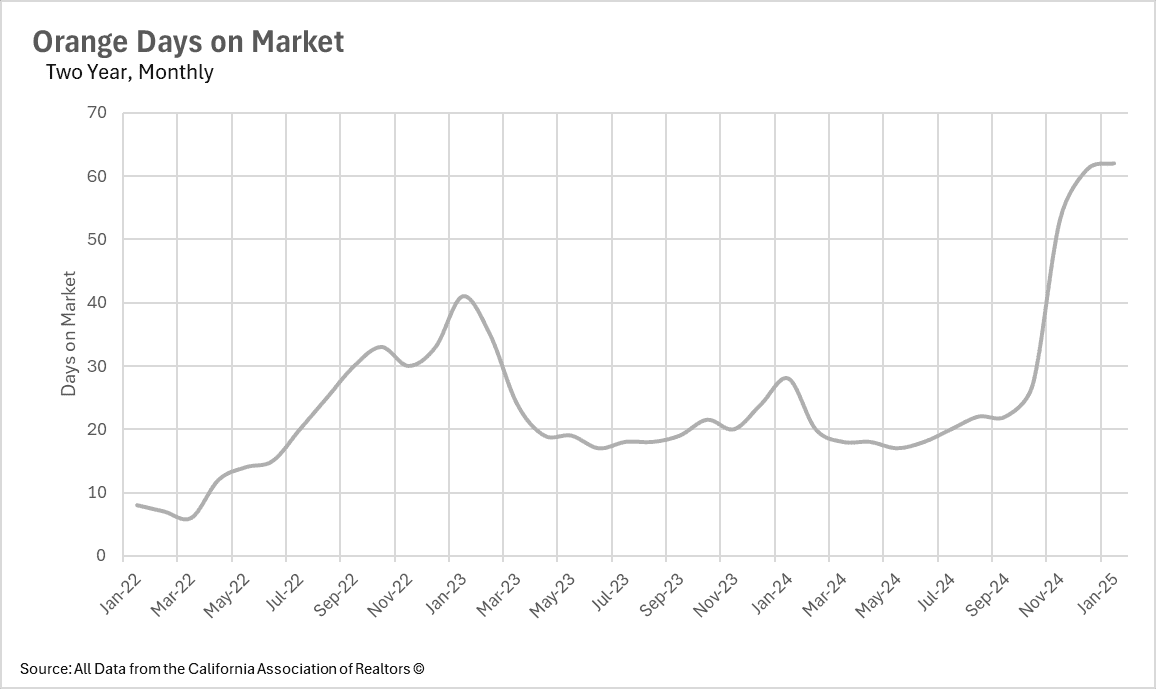
- Listings are sitting on the market for much longer, as inventory piles up on the side.
Note: You can find the charts/graphs for the Local Lowdown at the end of this section.
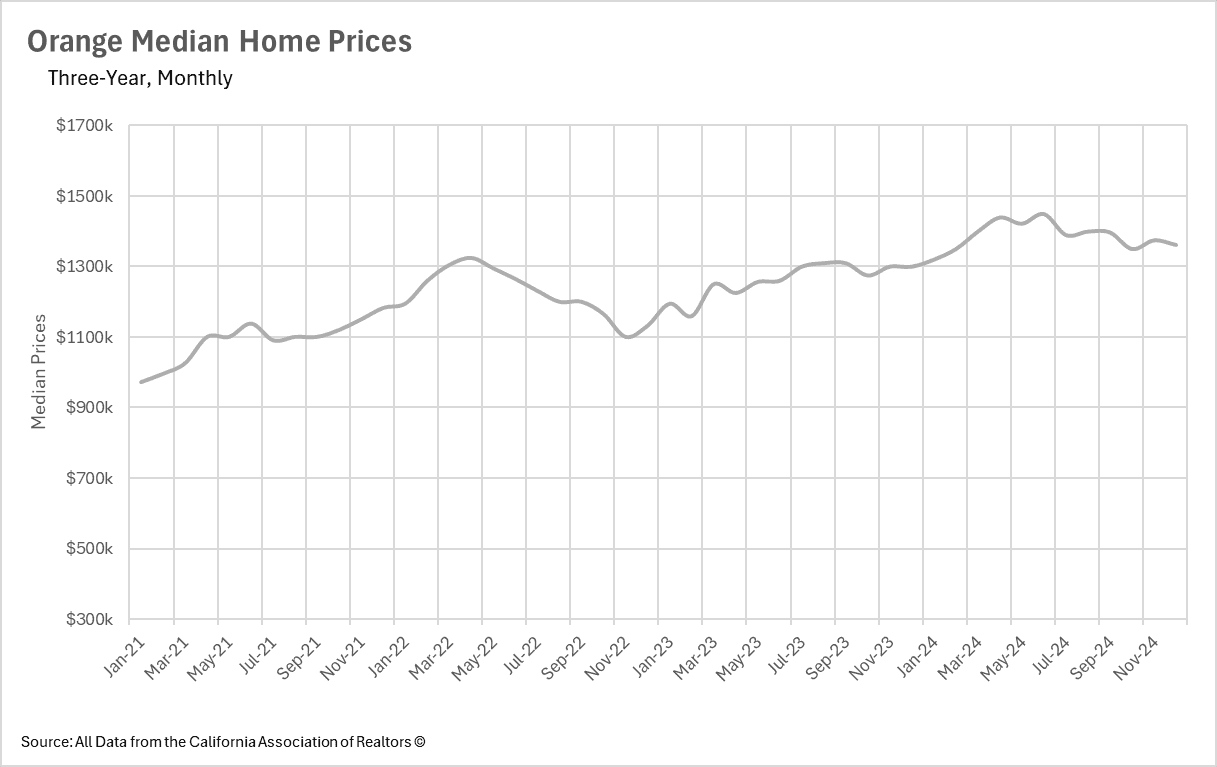
Orange County sale price growth continues to slow
Orange County has seen an incredible amount of appreciation over the course of the past couple of years, much like the rest of Southern California. However, over the course of the past few months, growth has begun to slow, as the area gets closer and closer to some tougher to beat year-over-year comps. When you couple this with the fact that inventory is beginning to flood the market, you have a recipe for stagnation in the future! However, we’ll have to wait and see what the future holds.
Inventory continues to pile in Orange County and the broader SoCal area
Although the Fed has cut interest rates a couple of times over the past few months, mortgage rates only briefly reflected this change in the cost of capital. Largely speaking, mortgage rates are closer to the levels we were seeing in August than the post-rate cut lows. This has caused buyers to be a bit more cautious, as they stop banking on the thought that they will be able to quickly refinance when rates come down in a year or two.
This skepticism has led inventory to pile up, as buyers weigh their options, with inventory levels rising by 46.42% in Orange County during January!
An influx in inventory has led listings to sit for longer on the market
As inventory enters the market in droves, this of course, forces buyers to take more time to view listings when making purchase related decisions. This often causes inventory to sit on the market for longer, which has certainly happened throughout Orange County and the Broader SoCal Area. Specifically in Orange County, we’ve seen inventory increase by 121.43% on a year-over-year basis. This wasn’t just a one-off month either, as the median listing sat on the market for 62 days in January, 61 days in December, and 53 days in November!
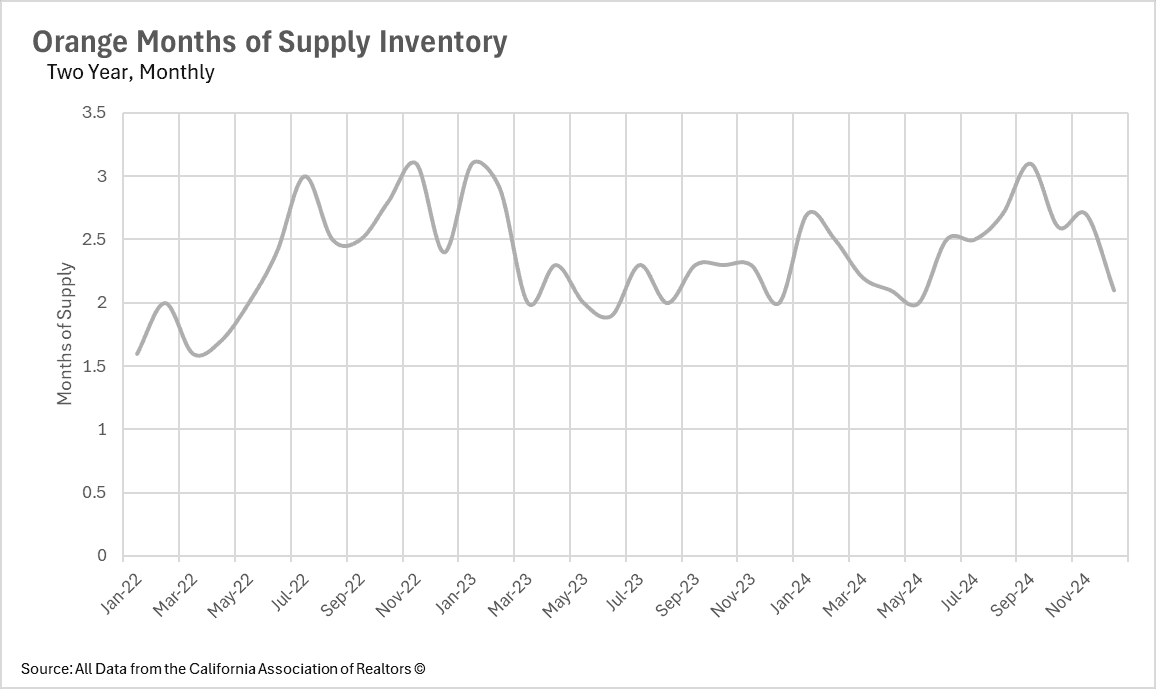
Orange County remains a sellers’ market for now
When determining whether a market is a buyers’ market or a sellers’ market, we look to the Months of Supply Inventory (MSI) metric. The state of California has historically averaged around three months of MSI, so any area with at or around three months of MSI is considered a balanced market. Any market that has lower than three months of MSI is considered a sellers’ market, whereas markets with more than three months of MSI are considered buyers’ markets.
Orange County is undoubtedly a hot market, and that shows in the number of months of supply it has. As of December, there are 2.1 months worth of supply listed in Orange County. This of course, means that it’s a rather strong sellers’ market, much like the rest of the SoCal area!
Local Lowdown Data